

Answered step by step
Verified Expert Solution
Question
1 Approved Answer
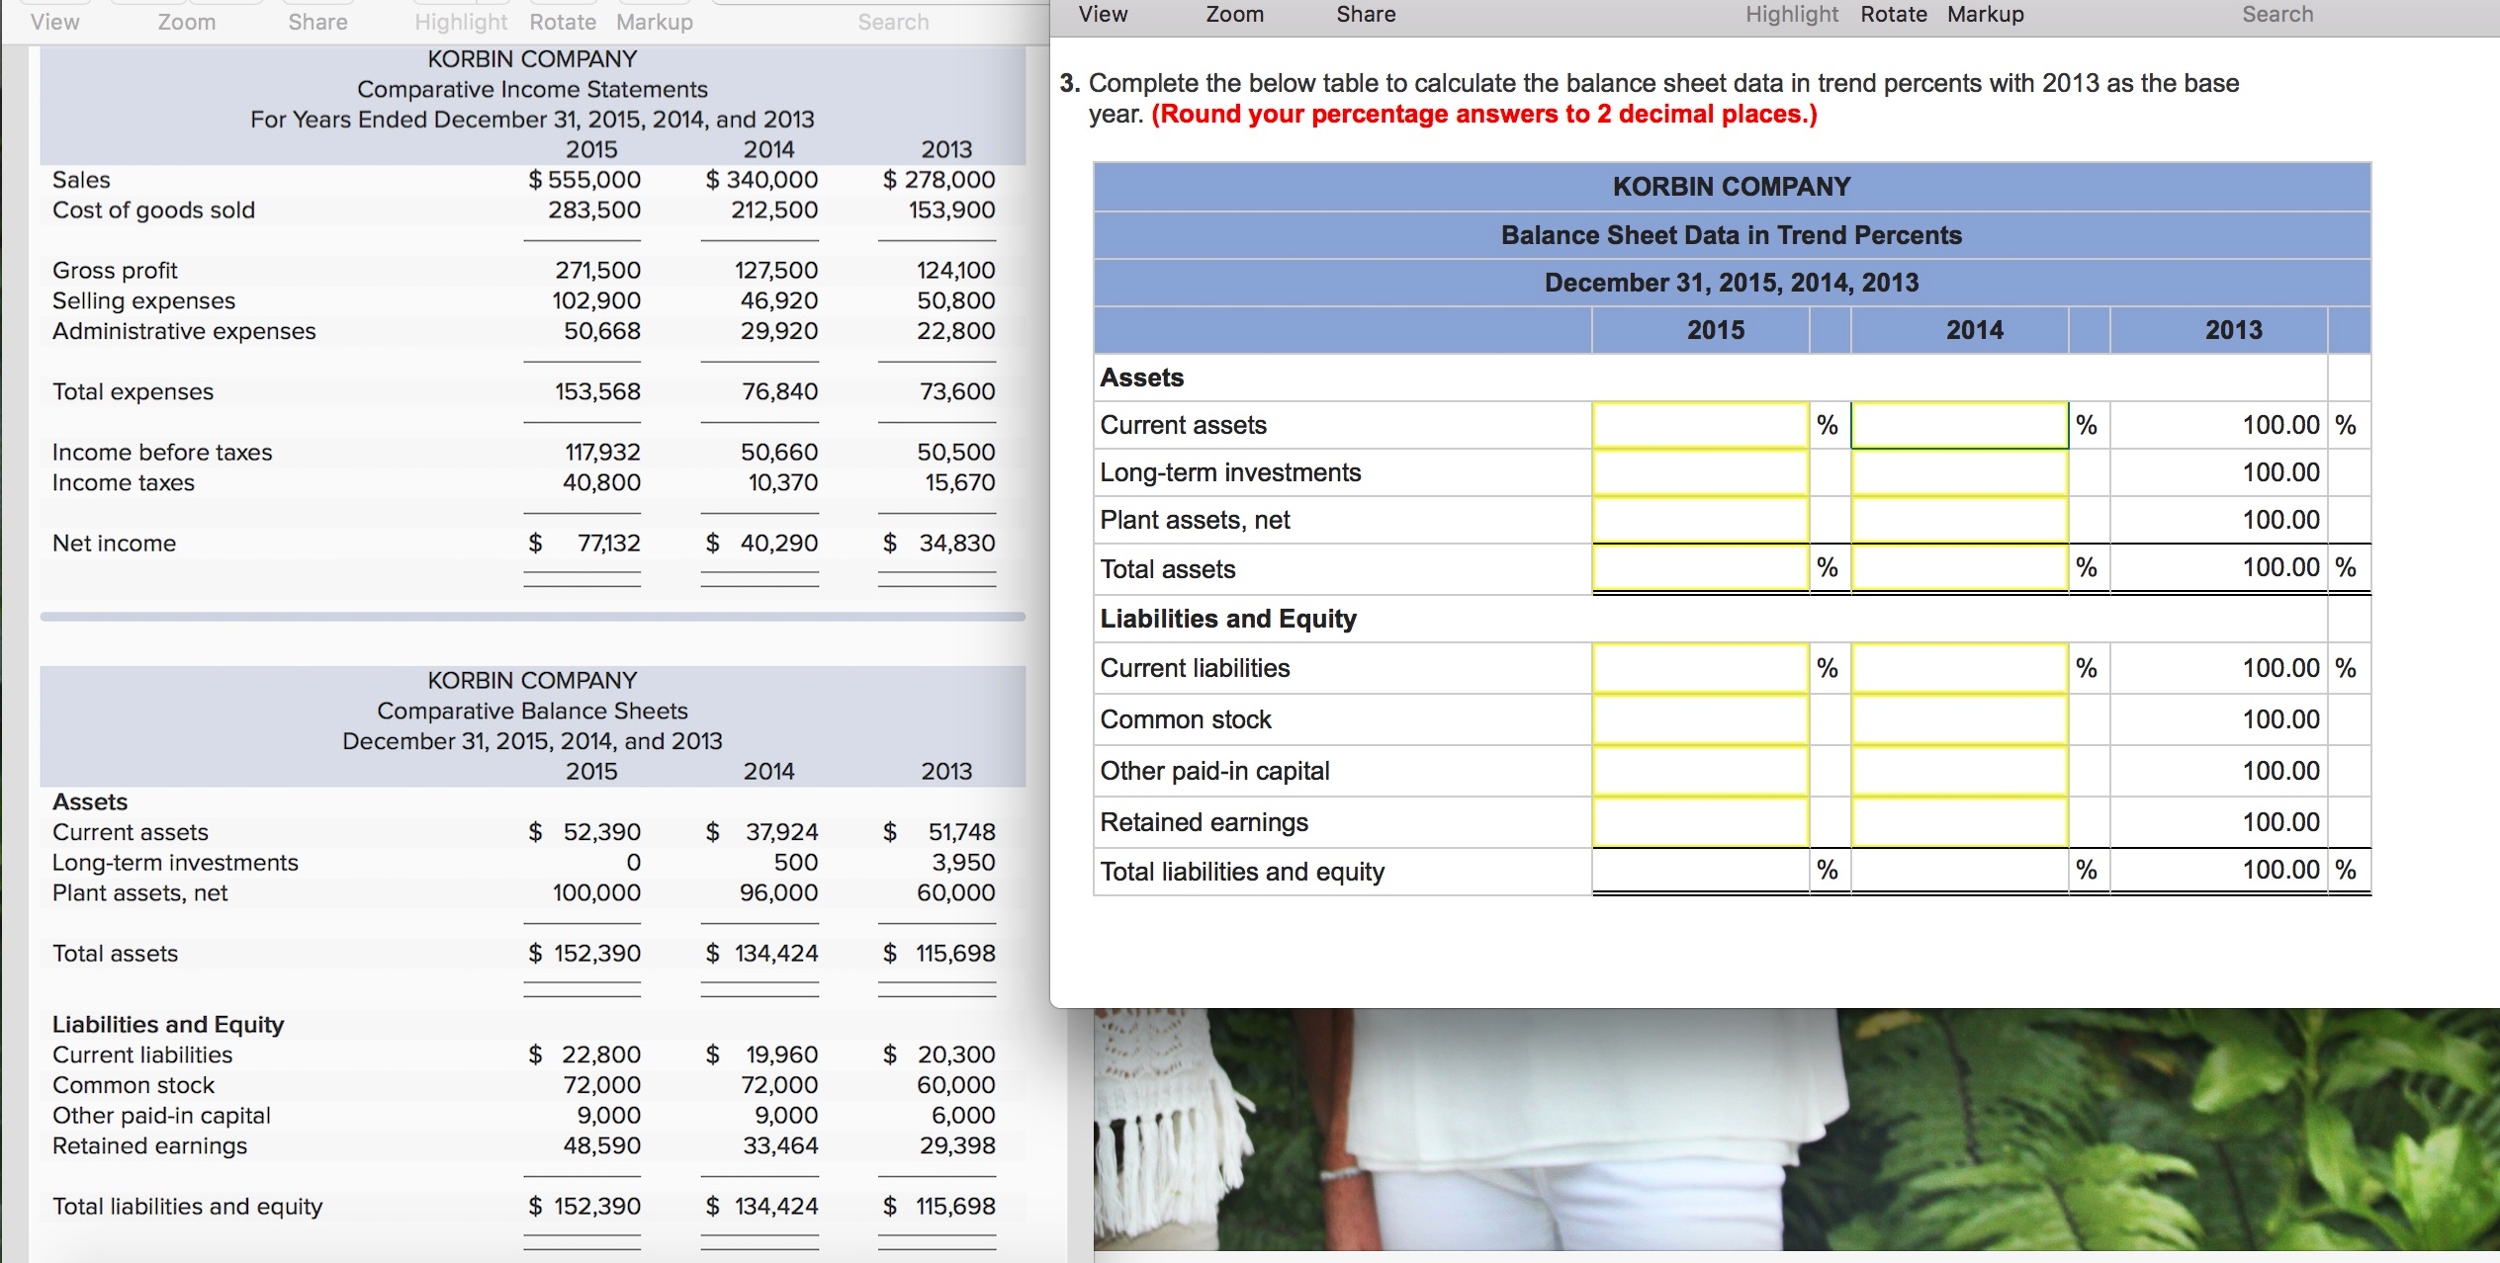
[The following information applies to the questions displayed below.] Selected comparative financial statements of Korbin Company follow Complete the below table to calculate the balance
[The following information applies to the questions displayed below.]
| Selected comparative financial statements of Korbin Company follow |
Complete the below table to calculate the balance sheet data in trend percents with 2013 as the base year.
Step by Step Solution
There are 3 Steps involved in it
Step: 1

Get Instant Access to Expert-Tailored Solutions
See step-by-step solutions with expert insights and AI powered tools for academic success
Step: 2

Step: 3
Ace Your Homework with AI
Get the answers you need in no time with our AI-driven, step-by-step assistance
Get Started
Cost Accounts An Explanation Of Principles And A Guide To Practice
Authors: Hawkins Leslie Whittem
1st Edition
124585450X, 978-1245854504