

Answered step by step
Verified Expert Solution
Question
1 Approved Answer
The following information applies to the questions displayed below.) Simon Company's year-end balance sheets follow. Current Yr 1 Yr Ago 2 Yes Ago At December
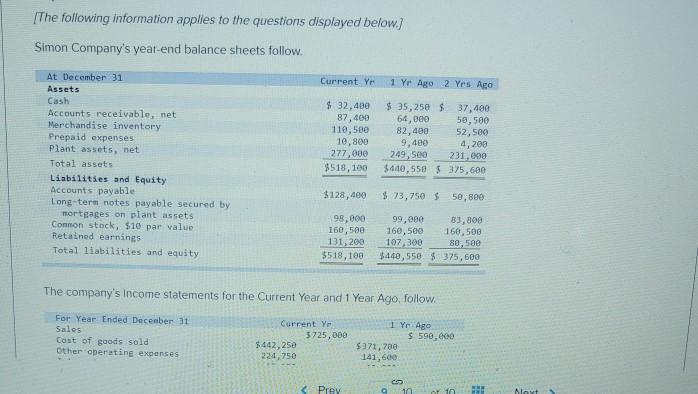
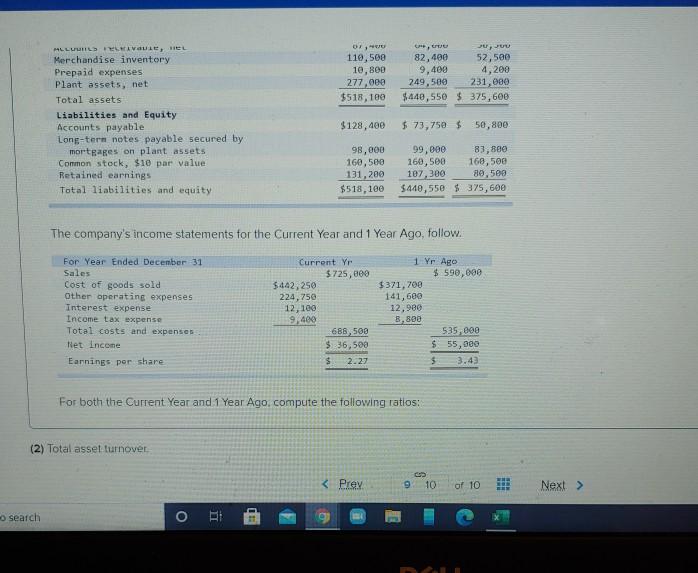
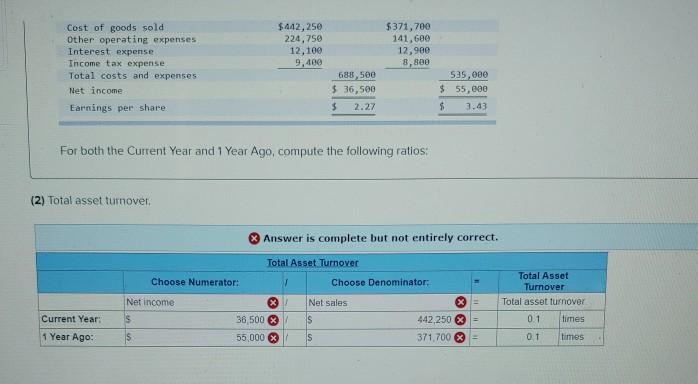
The following information applies to the questions displayed below.) Simon Company's year-end balance sheets follow. Current Yr 1 Yr Ago 2 Yes Ago At December 31 Assets Cash Accounts receivable, net Merchandise inventory Prepaid expenses Plant assets, net Total assets Liabilities and Equity Accounts payable Long-term notes payable secured by mortgages on plant assets Connon stock, $10 par value Retained earnings Total liabilities and equity $ 32,480 87,400 110,580 10,800 277,000 $518,100 $ 35,250 $ 37,400 64,000 50,500 82,400 52,500 9,400 4,200 249,500 231,000 $440,550 $375,600 $128,400 $ 73,750 $ 50, 800 98,000 160,500 131,200 $518,100 99,000 83,800 160,500 160,500 107,300 80,500 $440,550 $375,600 The company's income statements for the Current Year and 1 Year Ago follow. For Year Ended December 31 Sales Cost of goods sold Other operating expenses Current Ye 5725,000 $442,25e 224,750 1 Yr Ago $ 590,000 $371,700 141,600 Prey 10 10 BE Moyt 0, 110,500 10,80p 277,000 $518,100 CA, JU, JUU 82,400 52,500 9,400 4,209 249,500 231,000 $440,550 $375,600 HLLLL AV, el Merchandise inventory Prepaid expenses Plant assets, net Total assets Liabilities and Equity Accounts payable Long-term notes payable secured by mortgages on plant assets Common stock, $10 par value Retained earnings Total liabilities and equity $128,400 $ 73,750 $ 58,800 98,000 160,500 131,200 $518,100 99,000 83,800 160,500 168,500 107,300 80,500 $440,550 $ 375,600 The company's income statements for the Current Year and 1 Year Ago, follow. For Year Ended December 31 Sales Cost of goods sold Other operating expenses Interest expense Income tax expense Total costs and expenses Net Income Earnings por share Current Yr $725,000 $442,250 224,750 12, 100 9,480 688,500 $36,500 $ 2.27 1 yr Ago $ 590,000 $371,700 141,600 12,980 8,800 535,800 $ 55,300 5 3.43 For both the Current Year and 1 Year Ago compute the following ratios: (2) Total asset turnover o search O 10 . Cost of goods sold Other operating expenses Interest expense Income tax expense Total costs and expenses Net income Earnings per share $442,250 224,750 12,100 9,400 $371,700 141,600 12,900 8,800 688 500 $ 36,500 $ 2.27 535,000 $ 55,000 $ 3.43 For both the Current Year and 1 Year Ago, compute the following ratios: (2) Total asset turnover, Answer is complete but not entirely correct. Total Asset Turnover Choose Denominator: Choose Numerator: Net income s Net sales S Total Asset Turnover Total asset turnover 0.1 times x x Current Year: 1 Year Ago: 36,500 % 55,000 X 442,250 = 371.700 = S 0 1 times
Step by Step Solution
There are 3 Steps involved in it
Step: 1

Get Instant Access to Expert-Tailored Solutions
See step-by-step solutions with expert insights and AI powered tools for academic success
Step: 2

Step: 3
Ace Your Homework with AI
Get the answers you need in no time with our AI-driven, step-by-step assistance
Get Started
How To Audit Anything The Pink Book Of Auditing Any Process
Authors: R. Alakbarov
1st Edition
1520195575, 978-1520195575