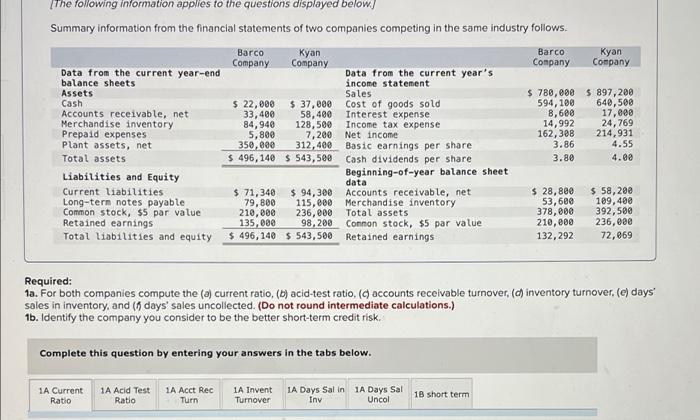
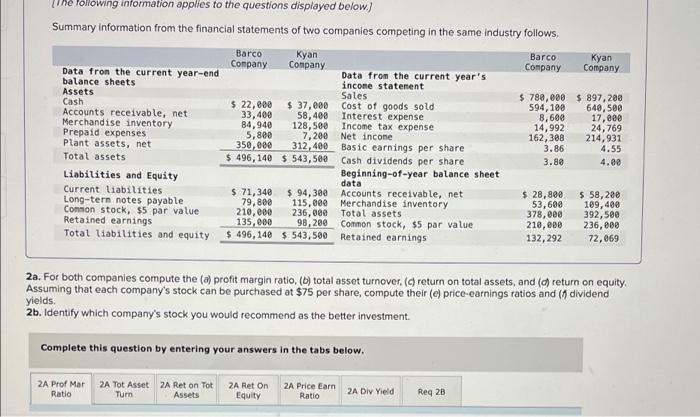
The following information applies to the questions displayed below! Summary information from the financial statements of two companies competing in the same industry follows. Barco Company Kyan Company Data from the current year-end balance sheets Assets Cash Accounts receivable, net Merchandise inventory Prepaid expenses Plant assets, net Total assets Liabilities and Equity Current liabilities Long-term notes payable Common stock, $5 par value Retained earnings Total liabilities and equity Barco Kyan Company Company Data from the current year's income statement Sales $ 22,000 $ 37,880 Cost of goods sold 33,400 58,400 Interest expense 84,940 128,500 Income tax expense 5,800 7,200 Net income 350,000 312,400 Basic earnings per share $ 496,140 $ 543,500 Cash dividends per share Beginning-of-year balance sheet data $ 71,340 $ 94,300 Accounts receivable, net 79,800 115,000 Merchandise inventory 210,000 236,000 Total assets 135,000 98,280 Connon stock, $5 par value $ 496, 140 $ 543,500 Retained earnings $ 780,000 $ 897,200 594,100 640,500 8,680 17,000 14,992 24,769 162,388 214,931 3.86 4.55 3.80 4.00 $ 28,880 53,600 378,000 210,000 132,292 $ 58,200 109,400 392,500 236,000 72,069 Required: 1a. For both companies compute the (a) current ratio, (b) acid-test ratio, ( accounts receivable turnover, () inventory turnover. (e) days' sales in inventory, and (7 days sales uncollected. (Do not round intermediate calculations.) 15. Identify the company you consider to be the better short-term credit risk. Complete this question by entering your answers in the tabs below. 1A Current Ratio 1A Acid Test Ratio 1A Acct Rec Turn 1A Invent Turnover IA Days Sal in 1A Days Sal Inv Uncol 1B short term The following information applies to the questions displayed below) Summary information from the financial statements of two companies competing in the same industry follows, Barco Kyan Barco Kyan Company Company Company Company Data from the current year-end Data from the current year's balance sheets income statement Assets Sales $ 780,000 $897,200 Cash $ 22,000 $ 37,000 Cost of goods sold 594,100 640,500 Accounts receivable, net 33, 400 58,400 Interest expense 8,600 17,000 Merchandise inventory 84,940 128,500 Income tax expense 14,992 24,769 Prepaid expenses 5,800 7,200 Net income 162,388 214,931 Plant assets, net 350,000 312,400 Basic earnings per share 3.86 4.55 Total assets $ 496, 140 $ 543,500 Cash dividends per share 3.80 4.00 Liabilities and Equity Beginning-of-year balance sheet data Current liabilities $ 71,340 $ 94,300 Accounts receivable, net $ 28,800 $ 58,200 Long-tern notes payable 79, 800 115,000 Merchandise inventory 53,600 109,400 Connon stock, $5 par value 210,000 236,000 Total assets 378,000 392,580 Retained earnings 135,000 98, 200 Common stock, $5 par value 210,000 236,000 Total liabilities and equity $ 496, 140 $ 543,500 Retained earnings 132,292 72,069 2a. For both companies compute the (a) profit margin ratio, (b) total asset turnover. () return on total assets, and (d) return on equity. Assuming that each company's stock can be purchased at $75 per share, compute their (e) price-earnings ratios and ( dividend yields. 2b. Identify which company's stock you would recommend as the better investment. Complete this question by entering your answers in the tabs below. 2A Prof Mar Ratio 2A Tot Asset 2A Ret on Tot Turn Assets ZA Ret On Equity 2A Price Earn 2A Div Yield Ratio Reg 28


