Answered step by step
Verified Expert Solution
Question
1 Approved Answer
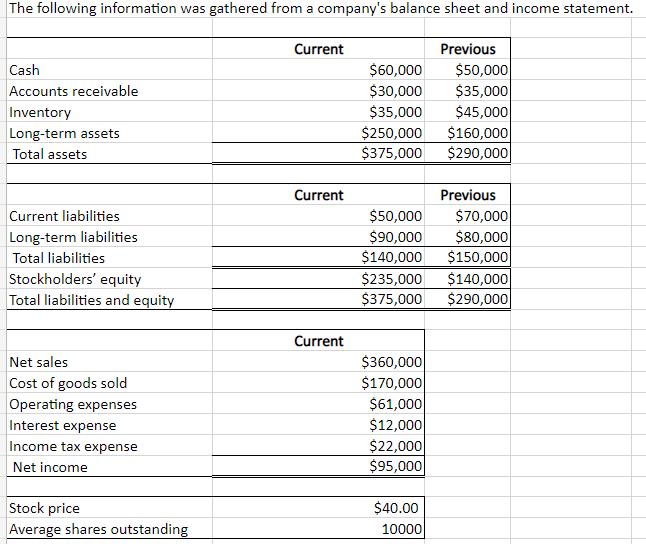
The following information was gathered from a company's balance sheet and income statement. Cash Accounts receivable Inventory Long-term assets Total assets Current liabilities Long-term


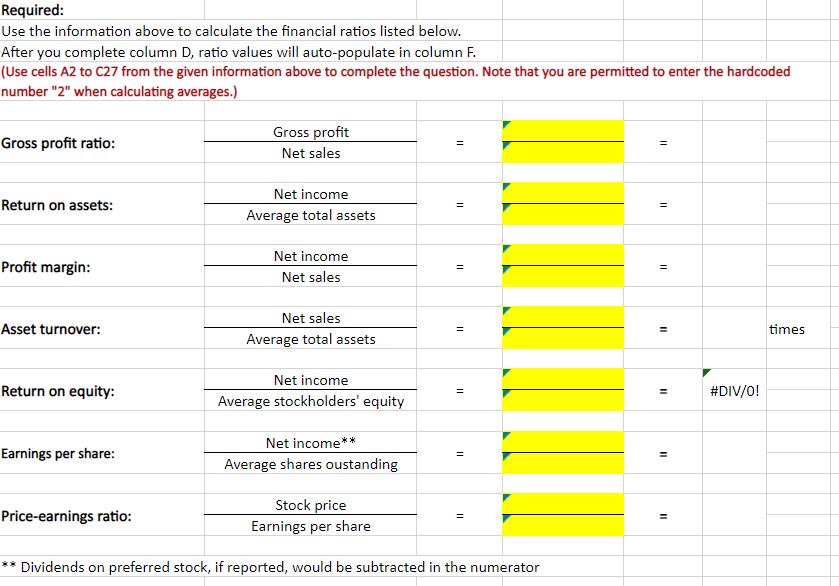
The following information was gathered from a company's balance sheet and income statement. Cash Accounts receivable Inventory Long-term assets Total assets Current liabilities Long-term liabilities Total liabilities Stockholders' equity Total liabilities and equity Net sales Cost of goods sold Operating expenses Interest expense Income tax expense Net income Stock price Average shares outstanding Current Current Current $60,000 $50,000 $30,000 $35,000 $35,000 $45,000 Previous $250,000 $160,000 $375,000 $290,000 Previous $50,000 $70,000 $90,000 $80,000 $140,000 $150,000 $235,000 $140,000 $375,000 $290,000 $360,000 $170,000 $61,000 $12,000 $22,000 $95,000 $40.00 10000 Required: Use the information above to calculate the financial ratios listed below. After you complete column D, ratio values will auto-populate in column F. (Use cells A2 to C27 from the given information above to complete the question. Note that you are permitted to enter the hardcoded number "2" when calculating averages.) Gross profit ratio: Return on assets: Profit margin: Asset turnover: Return on equity: Earnings per share: Gross profit Net sales Price-earnings ratio: Net income Average total assets Net income Net sales Net sales Average total assets Net income Average stockholders' equity Net income** Average shares oustanding = = = 11 = Stock price Earnings per share Dividends on preferred stock, if reported, would be subtracted in the numerator = = 11 11 = = = #DIV/0! times T The following information was gathered from a company's balance sheet and income statement. Cash Accounts receivable Inventory Long-term assets Total assets Current liabilities Long-term liabilities Total liabilities Stockholders' equity Total liabilities and equity Net sales Cost of goods sold Operating expenses Interest expense Income tax expense Net income Stock price Average shares outstanding Current Current Current $60,000 $50,000 $30,000 $35,000 $35,000 $45,000 Previous $250,000 $160,000 $375,000 $290,000 Previous $50,000 $70,000 $90,000 $80,000 $140,000 $150,000 $235,000 $140,000 $375,000 $290,000 $360,000 $170,000 $61,000 $12,000 $22,000 $95,000 $40.00 10000 Required: Use the information above to calculate the financial ratios listed below. After you complete column D, ratio values will auto-populate in column F. (Use cells A2 to C27 from the given information above to complete the question. Note that you are permitted to enter the hardcoded number "2" when calculating averages.) Gross profit ratio: Return on assets: Profit margin: Asset turnover: Return on equity: Earnings per share: Gross profit Net sales Price-earnings ratio: Net income Average total assets Net income Net sales Net sales Average total assets Net income Average stockholders' equity Net income** Average shares oustanding = = = 11 = Stock price Earnings per share Dividends on preferred stock, if reported, would be subtracted in the numerator = = 11 11 = = = #DIV/0! times T
Step by Step Solution
★★★★★
3.38 Rating (151 Votes )
There are 3 Steps involved in it
Step: 1
The detailed answer for the above question is provided below 1 Gross profit ratio G...
Get Instant Access to Expert-Tailored Solutions
See step-by-step solutions with expert insights and AI powered tools for academic success
Step: 2

Step: 3

Ace Your Homework with AI
Get the answers you need in no time with our AI-driven, step-by-step assistance
Get Started


