

Question
The following is a frequency polygon of monthly exchange rate changes in the US dollar/Japanese yen spot exchange rate for a four-year period. A positive
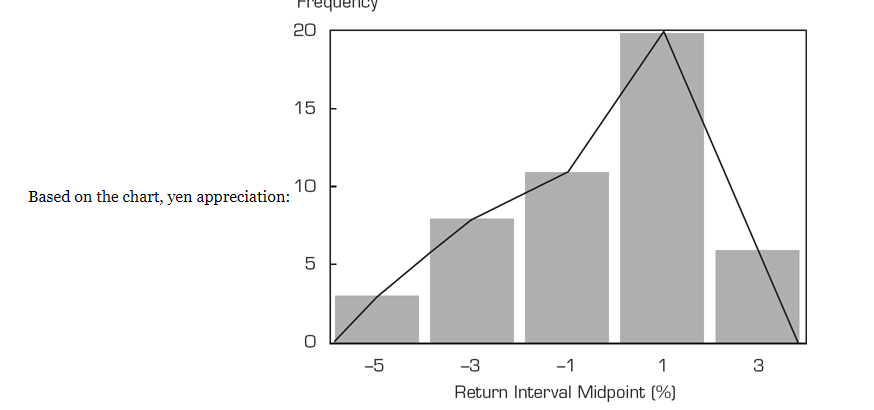 The following is a frequency polygon of monthly exchange rate changes in the US dollar/Japanese yen spot exchange rate for a four-year period. A positive change represents yen appreciation (the yen buys more dollars), and a negative change represents yen depreciation (the yen buys fewer dollars). Monthly Changes in the US Dollar/Japanese Yen Spot Exchange Rate
Based on the chart, yen appreciation:
| 1. was less frequent than yen depreciation. | ||
| 2. in the 0.0 to 2.0 interval occurred 20% of the time | ||
| 3.occurred more than 50% of the time | ||
| 4. was more frequent than yen depreciation. |
Step by Step Solution
There are 3 Steps involved in it
Step: 1

Get Instant Access to Expert-Tailored Solutions
See step-by-step solutions with expert insights and AI powered tools for academic success
Step: 2

Step: 3
Ace Your Homework with AI
Get the answers you need in no time with our AI-driven, step-by-step assistance
Get Started
Snap Judgment When To Trust Your Instincts When To Ignore Them And How To Avoid Making Big Mistakes With Your Money
Authors: David E. Adler
1st Edition
0137147783,0137037090