Answered step by step
Verified Expert Solution
Question
1 Approved Answer
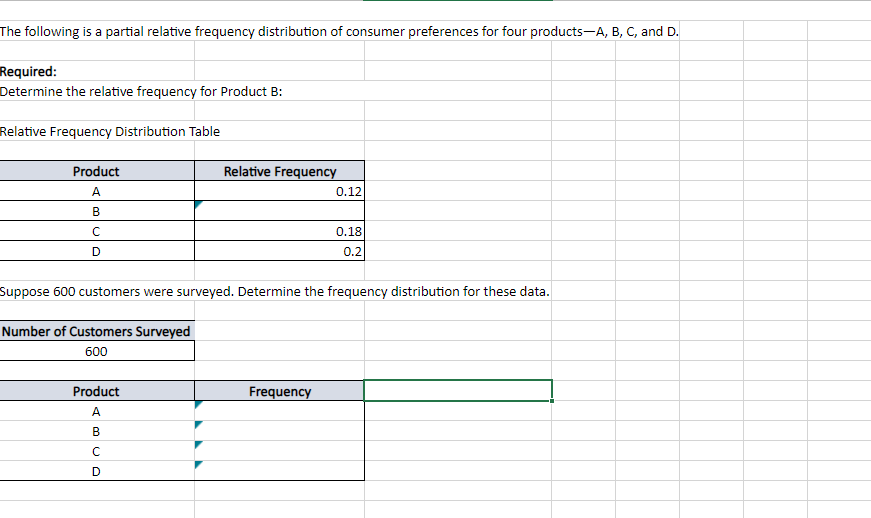
# The following is a partial relative frequency distribution of consumer preferences for four products-A, B, C, and D. Required: Determine the relative frequency for
 #
#The following is a partial relative frequency distribution of consumer preferences for four products-A, B, C, and D. Required: Determine the relative frequency for Product B: Relative Frequency Distribution Table Product A Relative Frequency 0.12 B C D 0.18 0.2 Suppose 600 customers were surveyed. Determine the frequency distribution for these data. Number of Customers Surveyed 600 Product A B C D Frequency
Step by Step Solution
There are 3 Steps involved in it
Step: 1
SureI can assist you with thisThe image you sent shows a partial relative frequency distribution tableThe relative frequency for product B is 02 This means that out of all the customers surveyed20 pre...
Get Instant Access to Expert-Tailored Solutions
See step-by-step solutions with expert insights and AI powered tools for academic success
Step: 2

Step: 3

Ace Your Homework with AI
Get the answers you need in no time with our AI-driven, step-by-step assistance
Get Started


