

Answered step by step
Verified Expert Solution
Question
1 Approved Answer
The following is STATA output from two OLS regressions of US real rates on consumption growth, the lagged value of the real rate and
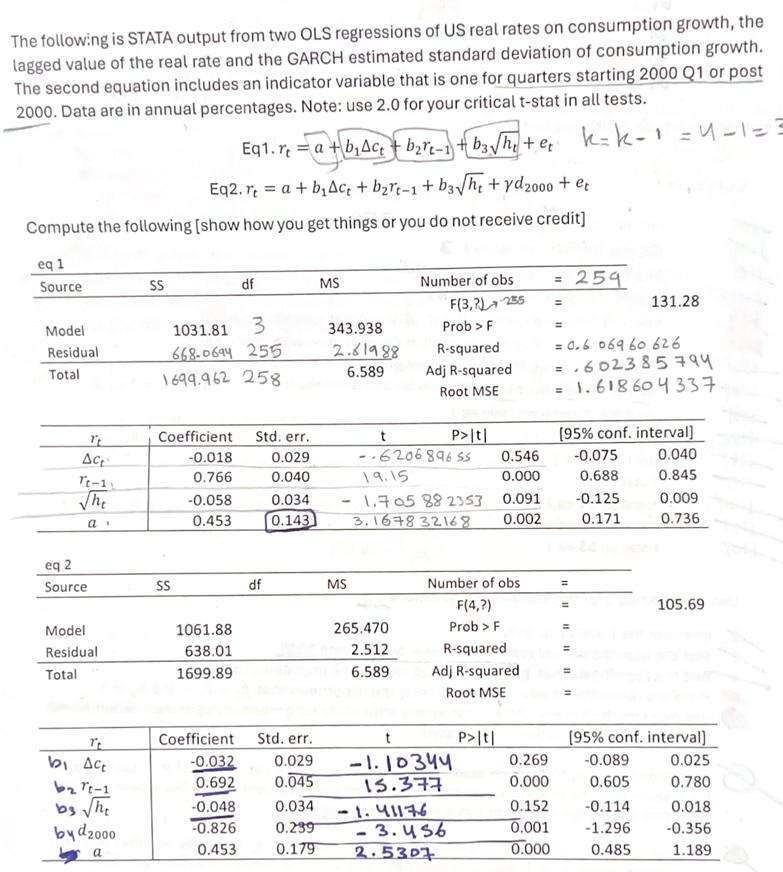
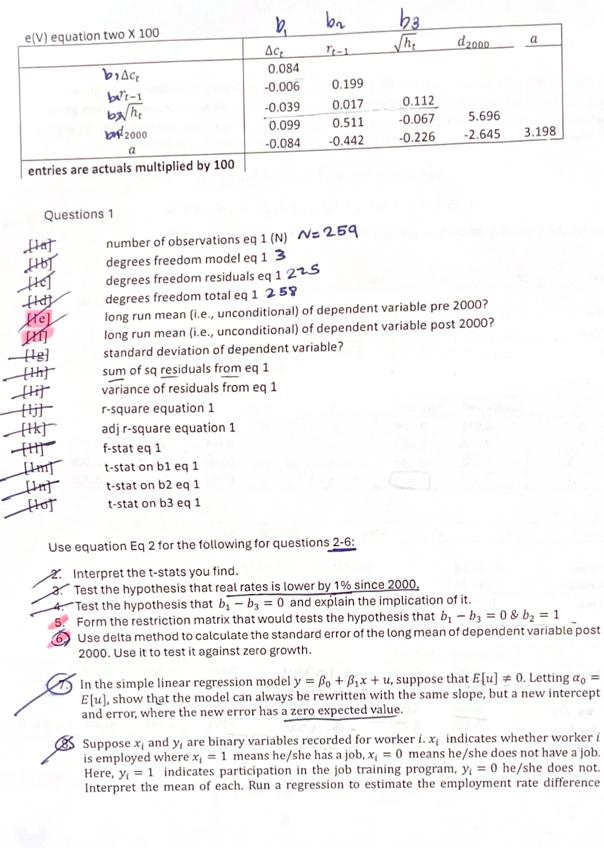
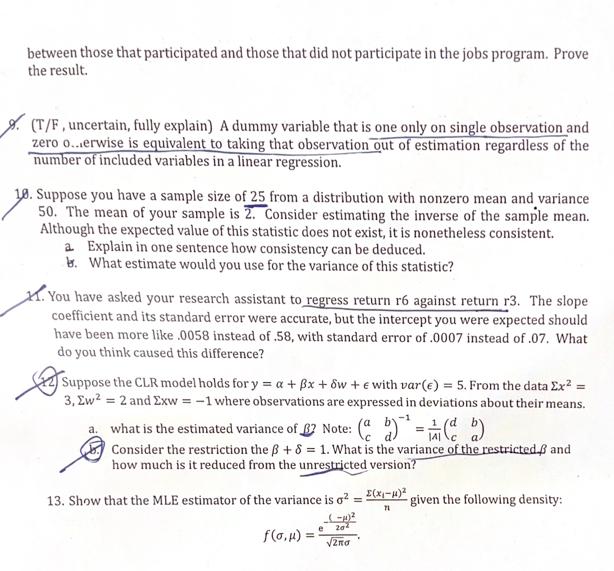
The following is STATA output from two OLS regressions of US real rates on consumption growth, the lagged value of the real rate and the GARCH estimated standard deviation of consumption growth. The second equation includes an indicator variable that is one for quarters starting 2000 Q1 or post 2000. Data are in annual percentages. Note: use 2.0 for your critical t-stat in all tests. Eq1.ra+bAct brt-1b3h+et k=k-1=4-1-3 Eq2. r = a + bAct + brt-1+b3he + yd 2000 + et Compute the following [show how you get things or you do not receive credit] eq 1 Source SS df MS Model Residual Total 1031.81 668-0694 255 3 343.938 1699.962 258 2.61988 6.589 Number of obs = 259 F(3,2)255 Prob > F R-squared = 131.28 = = 0.6 06960 626 Adj R-squared = .602385794 Root MSE = 1.618604337 T Coefficient Std. err. t P>\t\ [95% conf. interval] -0.018 0.029 -6206896 SS 0.546 -0.075 0.040 T-1 0.766 0.040 19.15 0.000 0.688 0.845 The -0.058 0.034 1.705 88 2353 0.091 -0.125 0.009 ai 0.453 0.143 3.1678 32168 0.002 0.171 0.736 eq 2 Source SS Model 1061.88 Residual 638.01 Total 1699.89 df MS Number of obs = F(4,7) = 105.69 265.470 Prob > F 2.512 R-squared 6.589 Adj R-squared Root MSE T Coefficient Std. err. t P>|t| [95% conf. interval] bi Act -0.032 0.029 -1.10344 0.269 -0.089 0.025 62 Tt-1 0.692 0.045 15.377 0.000 0.605 0.780 b3 he -0.048 0.034 1.41176 0.152 -0.114 0.018 by d2000 -0.826 0.239 -3.456 0.001 -1.296 -0.356 a 0.453 0.179 2.5307 0.000 0.485 1.189 e(V) equation two X 100 brace bili-1 b2000 a entries are actuals multiplied by 100 b 62 b3 T-1 The d2000 a 0.084 -0.006 0.199 -0.039 0.017 0.112 0.099 0.511 -0.067 5.696 -0.084 -0.442 -0.226 -2.645 3.198 number of observations eq 1 (N) N=259 Questions 1 Hat HHOT degrees freedom model eq 1 3 Hay He [g] 1417 degrees freedom residuals eq 1 225 degrees freedom total eq 1 258 long run mean (i.e., unconditional) of dependent variable pre 2000? long run mean (i.e., unconditional) of dependent variable post 2000? standard deviation of dependent variable? sum of sq residuals from eq 1 variance of residuals from eq 1 r-square equation 1 adj r-square equation 1 [H+] f-stat eq 1 t-stat on b1 eq 1 that t-stat on b2 eq 1 Hot t-stat on b3 eq 1 Use equation Eq 2 for the following for questions 2-6: Interpret the t-stats you find. Test the hypothesis that real rates is lower by 1% since 2000, Test the hypothesis that b-by=0 and explain the implication of it. 5 Form the restriction matrix that would tests the hypothesis that b-b3=0&b = 1 Use delta method to calculate the standard error of the long mean of dependent variable post 2000. Use it to test it against zero growth. In the simple linear regression model y = Bo+Bx+u, suppose that E[u] 0. Letting a = Elu], show that the model can always be rewritten with the same slope, but a new intercept and error, where the new error has a zero expected value. Suppose x and y, are binary variables recorded for worker i. x, indicates whether worker i is employed where x, 1 means he/she has a job, x = 0 means he/she does not have a job. Here, y 1 indicates participation in the job training program, y = 0 he/she does not. Interpret the mean of each. Run a regression to estimate the employment rate difference between those that participated and those that did not participate in the jobs program. Prove the result. (T/F, uncertain, fully explain) A dummy variable that is one only on single observation and zero o...erwise is equivalent to taking that observation out of estimation regardless of the number of included variables in a linear regression. 18. Suppose you have a sample size of 25 from a distribution with nonzero mean and variance 50. The mean of your sample is 2. Consider estimating the inverse of the sample mean. Although the expected value of this statistic does not exist, it is nonetheless consistent. a Explain in one sentence how consistency can be deduced. b. What estimate would you use for the variance of this statistic? You have asked your research assistant to regress return r6 against return r3. The slope coefficient and its standard error were accurate, but the intercept you were expected should have been more like .0058 instead of .58, with standard error of .0007 instead of .07. What do you think caused this difference? Suppose the CLR model holds for y = a + x + Sw+e with var(e) = 5. From the data Ex= 3, Ew = 2 and Exw=-1 where observations are expressed in deviations about their means. what is the estimated variance of Note: (ab) = (db) a. Consider the restriction the +8 = 1. What is the variance of the restricted, and how much is it reduced from the unrestricted version? 13. Show that the MLE estimator of the variance is o = (1-x)3 given the following density: f(,)= -2 202 = 2nd
Step by Step Solution
There are 3 Steps involved in it
Step: 1

Get Instant Access to Expert-Tailored Solutions
See step-by-step solutions with expert insights and AI powered tools for academic success
Step: 2

Step: 3
Ace Your Homework with AI
Get the answers you need in no time with our AI-driven, step-by-step assistance
Get Started
A Short Course In Automorphic Functions
Authors: Joseph Lehner
1st Edition
0486799921, 9780486799926