Answered step by step
Verified Expert Solution
Question
1 Approved Answer
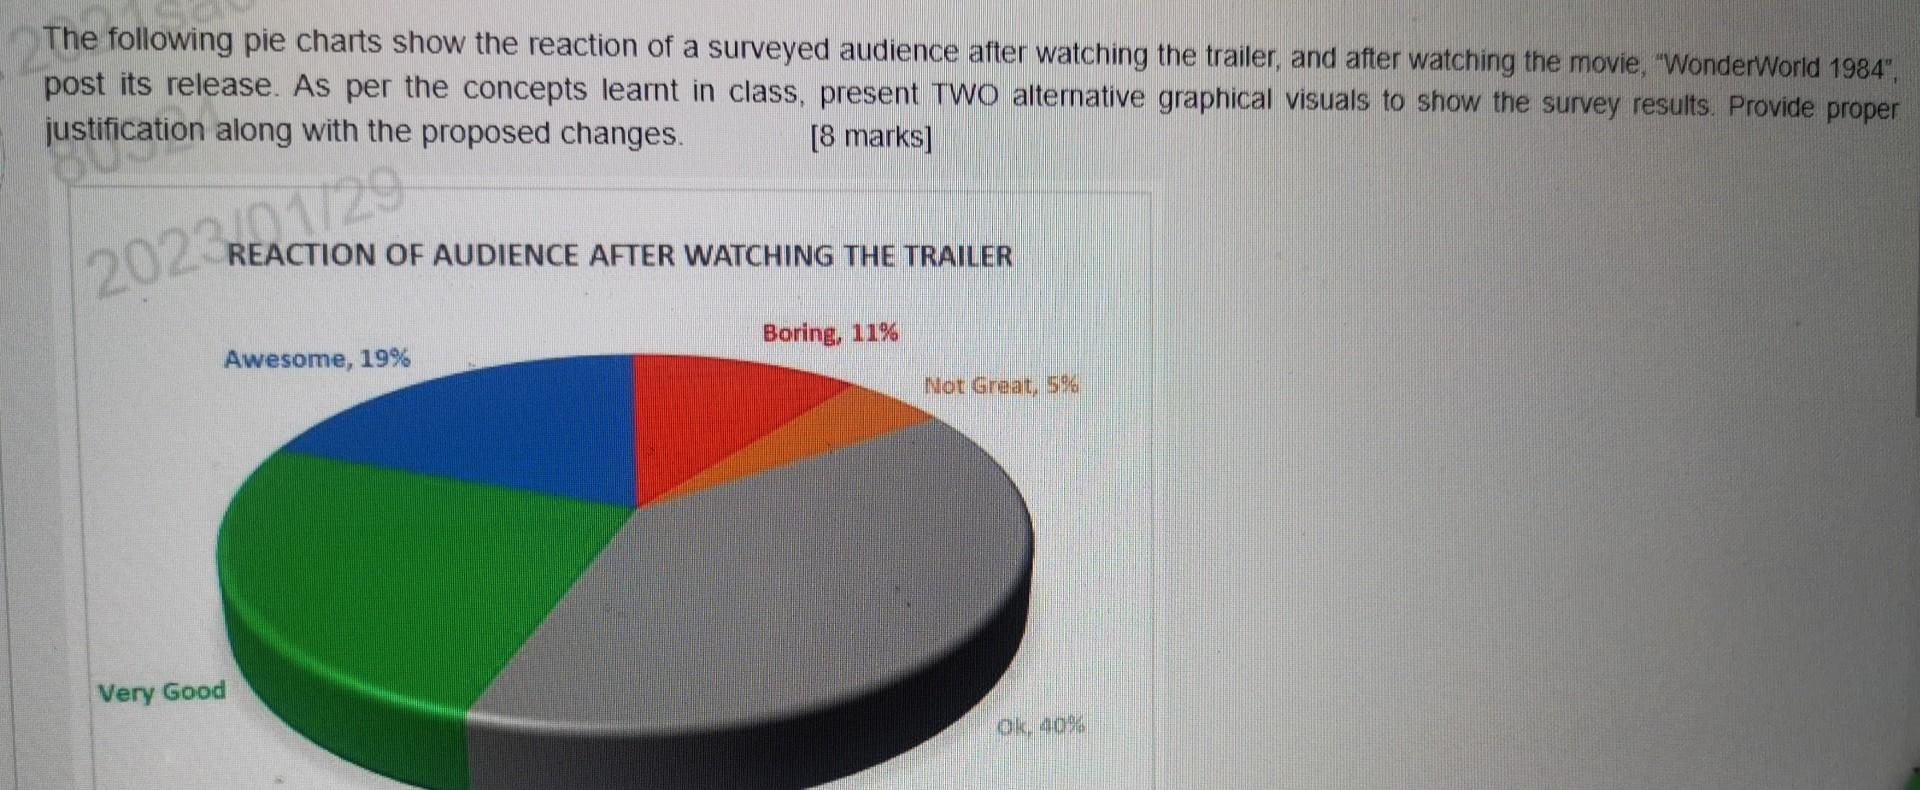
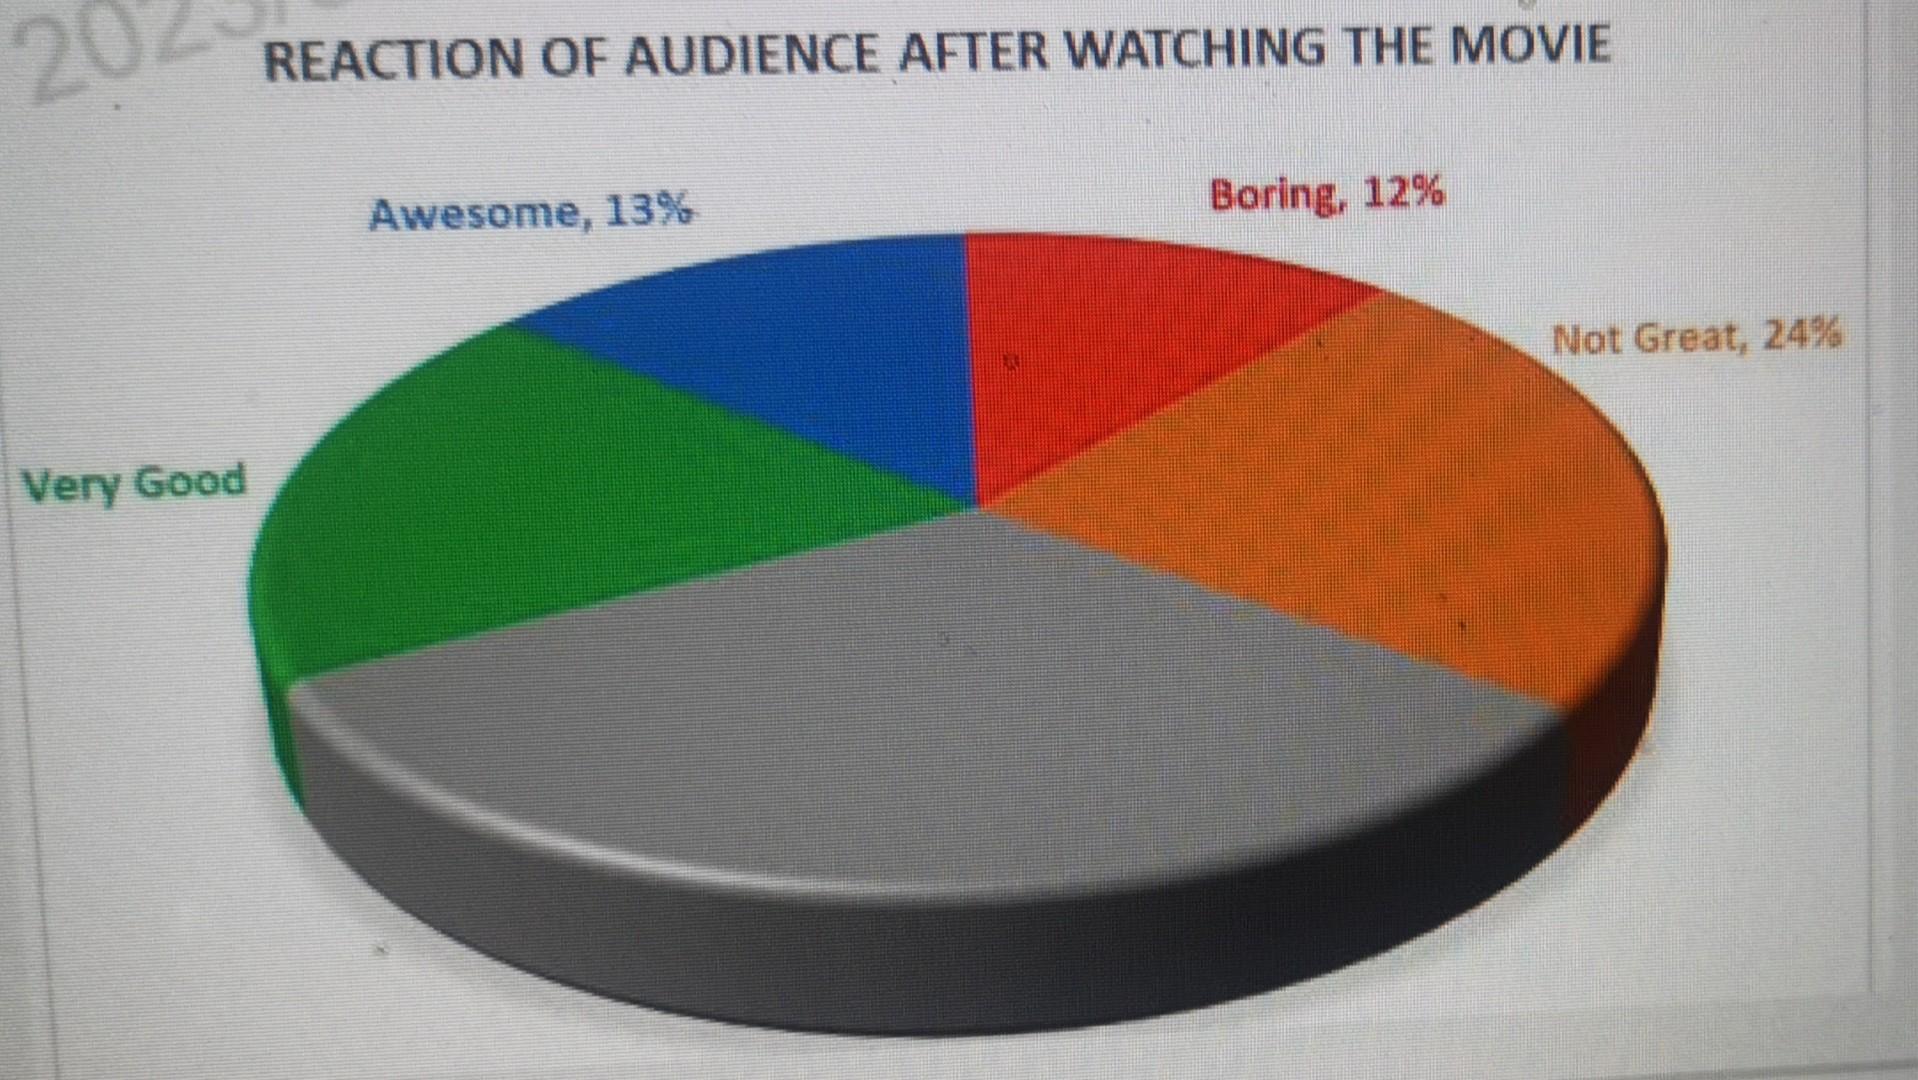
The following pie charts show the reaction of a surveyed audience after watching the trailer, and after watching the movie, Wonderworld 1984 , post its


The following pie charts show the reaction of a surveyed audience after watching the trailer, and after watching the movie, "Wonderworld 1984 ", post its release. As per the concepts learnt in class, present TWO alternative graphical visuals to show the survey results. Provide proper justification along with the proposed changes. [8 marks] REACTION OF AUDIENCE AFTER WATCHING THE TRAILER REACTION OF AUDIENCE AFTER WATCHING THE MOVIE
Step by Step Solution
There are 3 Steps involved in it
Step: 1

Get Instant Access to Expert-Tailored Solutions
See step-by-step solutions with expert insights and AI powered tools for academic success
Step: 2

Step: 3

Ace Your Homework with AI
Get the answers you need in no time with our AI-driven, step-by-step assistance
Get Started


