

Answered step by step
Verified Expert Solution
Question
1 Approved Answer
The following plot depicts cumulative abnormal returns over 36 months following an announcement for firms that initiated a new dividend and for firms that omitted
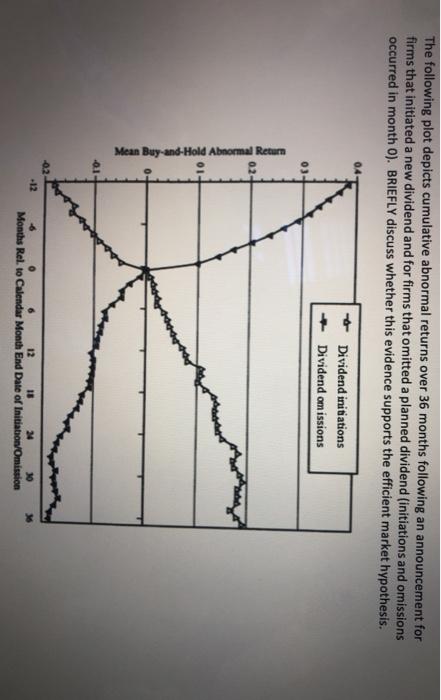 The following plot depicts cumulative abnormal returns over 36 months following an announcement for firms that initiated a new dividend and for firms that omitted a planned dividend (initiations and omissions occurred in month O). BRIEFLY discuss whether this evidence supports the efficient market hypothesis. 04 Dividend initiations Dividend omissions 03 02- Mean Buy-and-Hold Abnormal Return 01- -01 -02 12 18 24 30 Months Rel. to Calendar Month End Date of Initiation/Omission The following plot depicts cumulative abnormal returns over 36 months following an announcement for firms that initiated a new dividend and for firms that omitted a planned dividend (initiations and omissions occurred in month O). BRIEFLY discuss whether this evidence supports the efficient market hypothesis. 04 Dividend initiations Dividend omissions 03 02- Mean Buy-and-Hold Abnormal Return 01- -01 -02 12 18 24 30 Months Rel. to Calendar Month End Date of Initiation/Omission
Step by Step Solution
There are 3 Steps involved in it
Step: 1

Get Instant Access to Expert-Tailored Solutions
See step-by-step solutions with expert insights and AI powered tools for academic success
Step: 2

Step: 3
Ace Your Homework with AI
Get the answers you need in no time with our AI-driven, step-by-step assistance
Get Started
Your Financial Well Being How To Get Your Financial Well Being With Smart Spending Habits
Authors: Fransisca Patten
1st Edition
979-8388729705