

Question
*The following question requires to be answered through MATLAB* Enter the following data into the Matlab editor window: year = [ 1980 1985 1990 1995
*The following question requires to be answered through MATLAB*
Enter the following data into the Matlab editor window:
year = [ 1980 1985 1990 1995 2000 2005 2010 ]'; airtime_music = [ 95 83 65 40 20 10 5 ]'; airtime_musicawards = [ 0 12 20 30 30 30 30 ]'; airtime_other = 100 - airtime_music - airtime_musicawards;
Create a graph that looks like the graph below using the Matlab function area. You only have to call the area function once -- do not build up the graph one color area at a time. The trick is to put the data in a matrix and pass the matrix to the area function. Paste the Matlab code (multiple lines are fine) that you used to recreate this figure. 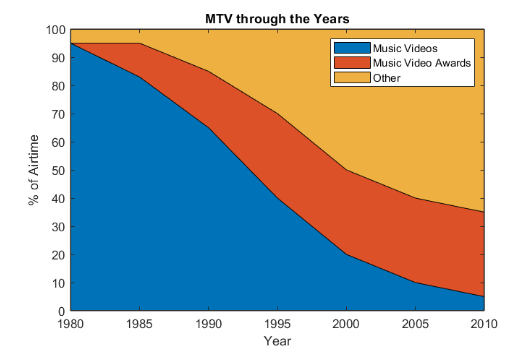
Step by Step Solution
There are 3 Steps involved in it
Step: 1

Get Instant Access to Expert-Tailored Solutions
See step-by-step solutions with expert insights and AI powered tools for academic success
Step: 2

Step: 3
Ace Your Homework with AI
Get the answers you need in no time with our AI-driven, step-by-step assistance
Get Started
Beginning C# 5.0 Databases
Authors: Vidya Vrat Agarwal
2nd Edition
1430242604, 978-1430242604