Question
The following results were obtained when each of a series of standard silver solutions was analyses by flame atomic-absorption spectrometry. Concentration, ng mL-' 10

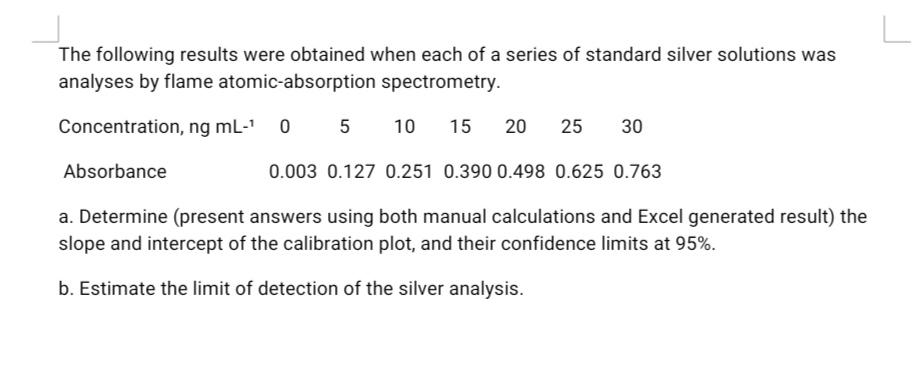
The following results were obtained when each of a series of standard silver solutions was analyses by flame atomic-absorption spectrometry. Concentration, ng mL-' 10 15 20 25 30 Absorbance 0.003 0.127 0.251 0.390 0.498 0.625 0.763 a. Determine (present answers using both manual calculations and Excel generated result) the slope and intercept of the calibration plot, and their confidence limits at 95%. b. Estimate the limit of detection of the silver analysis.
Step by Step Solution
3.31 Rating (148 Votes )
There are 3 Steps involved in it
Step: 1
Concentration Vs Absorbance excel plot is given below Concentr...
Get Instant Access to Expert-Tailored Solutions
See step-by-step solutions with expert insights and AI powered tools for academic success
Step: 2

Step: 3

Ace Your Homework with AI
Get the answers you need in no time with our AI-driven, step-by-step assistance
Get StartedRecommended Textbook for
Organic Chemistry
Authors: Joseph M. Hornback
2nd Edition
9781133384847, 9780199270293, 534389511, 1133384846, 978-0534389512
Students also viewed these Chemistry questions
Question
Answered: 1 week ago
Question
Answered: 1 week ago
Question
Answered: 1 week ago
Question
Answered: 1 week ago
Question
Answered: 1 week ago
Question
Answered: 1 week ago
Question
Answered: 1 week ago
Question
Answered: 1 week ago
Question
Answered: 1 week ago
Question
Answered: 1 week ago
Question
Answered: 1 week ago
Question
Answered: 1 week ago
Question
Answered: 1 week ago
Question
Answered: 1 week ago
Question
Answered: 1 week ago
Question
Answered: 1 week ago
Question
Answered: 1 week ago
Question
Answered: 1 week ago
Question
Answered: 1 week ago
Question
Answered: 1 week ago
View Answer in SolutionInn App


