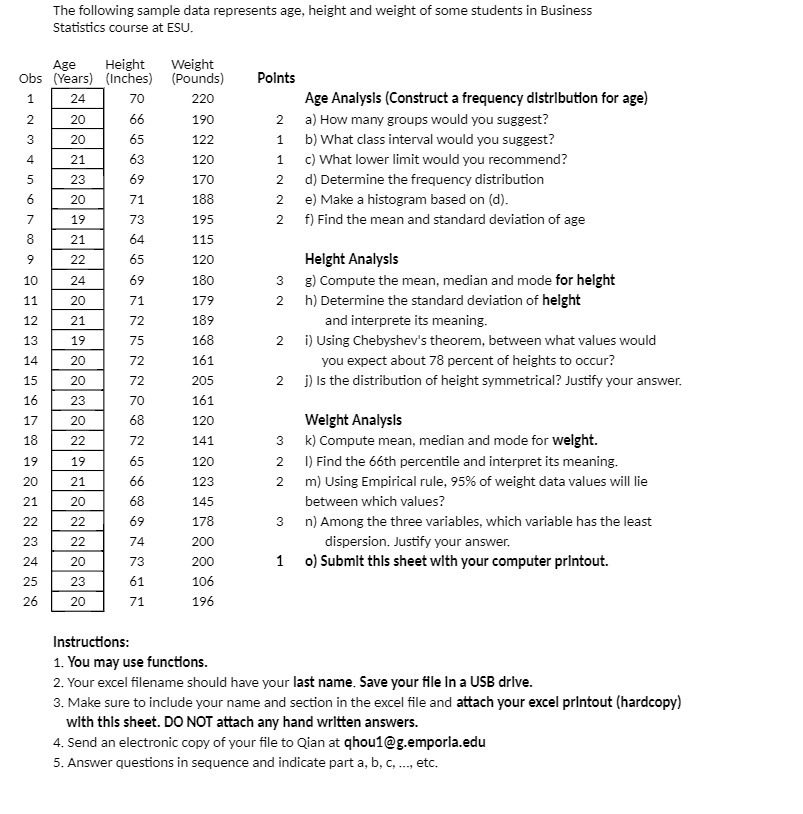
The following sample data represents age, height and weight of some students in Business Statistics course at ESU. Age Height 1Weight lIL'Ibs Wears] {inches} [Pounds] Points \\DUMUHmhtOMH H i4 as H s: H s: H s: H m to u 01L\" o m hJ H G To 220 Age Analysis {Construct a frequency distribution for age] 66 190 2 all How marry groups would you suggest? 65 122 1 b} What class interval would you suggest? 63 12C! 1 c} What lower limit would you recommend? 69 1m 2 d] Determine the frequency distribution 71 133 2 ell Make a histogram based on {d}. 73 195 2 f] Find the mean and standard deviation of age 64 115 as 120 Height Analysis 69 130 3 g} Compute the mean, median and mode for height Tl 1NF 2 h} Determine the standard deviation of height 22 139 and interprete its meaning. 75 163 2 i] Using Chebyshey's theorem1 between what values would 72 161 you expect about 23 percent of heights to occur? 72 205 2 j]| Is the distribution of height symmetrical? Justify your answer. TO 161 as 120 Weight Analysis 7'2 141 3 k] Compute mean, median and mode for weight. 65 120 2 I] Find the 66th percentile and interpret its meaning. 66 123 2 m] Using Empirical rule. 95% of weight data values will lie 63 145 between which values? 69 123 3 n} Arno ng the three variables, which yaria ble has the least 7'4 200 dispersion. Justify your answer. T3 200 1 o} Submit this sheet with your computer printout. :51 106 20 ?1 193 Instructions: 1. You may use functions. 2- Your excel lename should have your last name. Save your file in 3 USE drive. 3. Make sure to include your name and section in the excel file and attach your excel printout [hardcopyi with this sheet. DO NOT attach any hanci mitten answers. 4. Send an electronic copryr of your file to Qian at qhou1@g.emporia.edu 5. Answer questions in sequence and indicate part a, b, c, ..., etc