Answered step by step
Verified Expert Solution
Question
1 Approved Answer
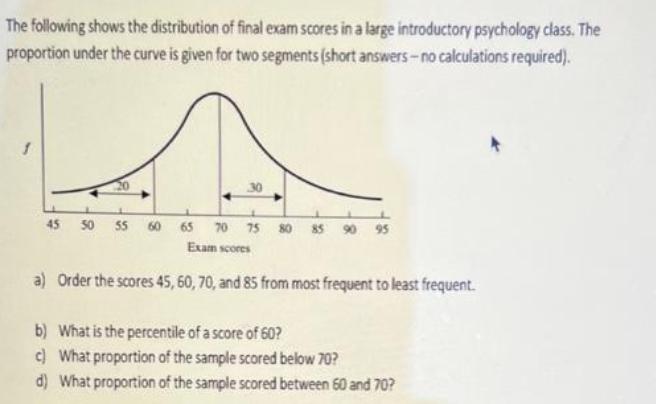
The following shows the distribution of final exam scores in a large introductory psychology class. The proportion under the curve is given for two

The following shows the distribution of final exam scores in a large introductory psychology class. The proportion under the curve is given for two segments (short answers-no calculations required). 45 50 55 60 65 70 75 80 Exam scores a) Order the scores 45, 60, 70, and 85 from most frequent to least frequent. b) What is the percentile of a score of 60? c) What proportion of the sample scored below 70? d) What proportion of the sample scored between 60 and 70?
Step by Step Solution
There are 3 Steps involved in it
Step: 1
Lets analyze the given information and solve each part of the question step by step a Order the scor...
Get Instant Access to Expert-Tailored Solutions
See step-by-step solutions with expert insights and AI powered tools for academic success
Step: 2

Step: 3

Ace Your Homework with AI
Get the answers you need in no time with our AI-driven, step-by-step assistance
Get Started


