Answered step by step
Verified Expert Solution
Question
1 Approved Answer
The following Spreadsheet is an example of such a model. Column B contains the inputs we have used so far for Honda. Column E

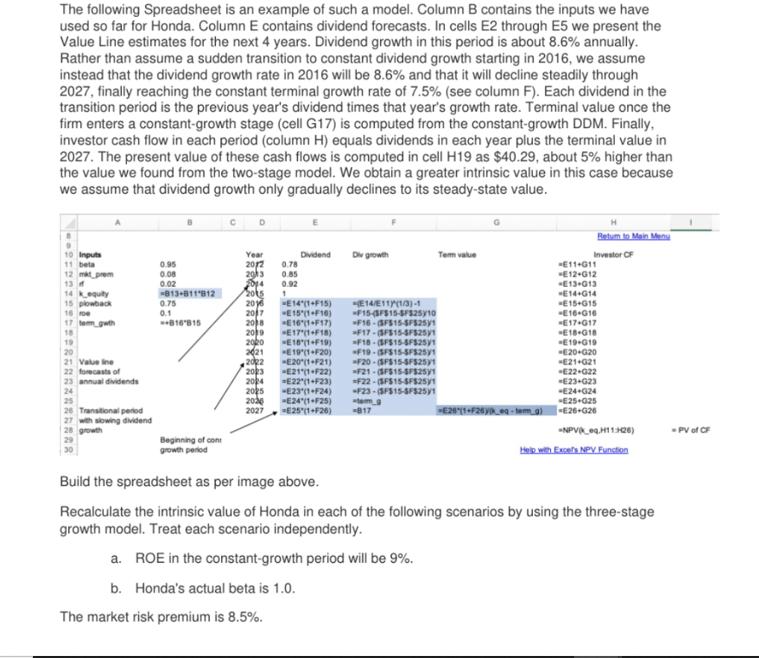
The following Spreadsheet is an example of such a model. Column B contains the inputs we have used so far for Honda. Column E contains dividend forecasts. In cells E2 through E5 we present the Value Line estimates for the next 4 years. Dividend growth in this period is about 8.6% annually. Rather than assume a sudden transition to constant dividend growth starting in 2016, we assume instead that the dividend growth rate in 2016 will be 8.6% and that it will decline steadily through 2027, finally reaching the constant terminal growth rate of 7.5% (see column F). Each dividend in the transition period is the previous year's dividend times that year's growth rate. Terminal value once the firm enters a constant-growth stage (cell G17) is computed from the constant-growth DDM. Finally, investor cash flow in each period (column H) equals dividends in each year plus the terminal value in 2027. The present value of these cash flows is computed in cell H19 as $40.29, about 5% higher than the value we found from the two-stage model. We obtain a greater intrinsic value in this case because we assume that dividend growth only gradually declines to its steady-state value. D 10 Inputs 11 beta 12 mat prem 13 f equity 14 15 plowback 16 ro 17 tem gwth 18 Value ine 22 forecasts of 23 annual dividends 24 25 26 Transitional period 27 with slowing dividend growth 0.95 0.08 0.02 -813-811812 0.75 0.1 816815 Beginning of cont growth period C D Year 20/2 0.78 2013 0.85 2014 0.92 2015 1 Dividend 2016 XETAITHF15) 2017 E15(1-F10) 2018 E16*(1+F17) 2019 2020 2021 E19 (1+F20) 2022 -E20(1+F21) 2023 -E21*(1+F22) 2024 -E22*(1+F23) 2025 2030 2027 The market risk premium is 8.5%. -E17 (1+F18) -E18 (1+F19) -E23 (1+F24) -E24 (1+F25) E25*(1+F26) Div growth E14/E11)(1/3)-1 -F15-FS15-$F$25y10 F16-3FS15-5F5251 F17-SFS15-4F5251 F18-(SFS15-8F5251 -F19-(SFS15-5F5251 -F20-(SFS15-5F5251 -F21-(SFS15-SFS251 -F22-(SFS15-4F5251 -F23-(SFS15-5F5251 term_g -817 Tem value +E28"(1+F26y_eq-tem_g) H Betum to Main Menu Investor CF *11+011 -E12 G12 -E13-013 *E14+G14 -E15+15 -E16 G16 -E17.G17 E18 G18 -E19+G19 -E20-020 -E21+021 -E22-022 E23-G23 -E24+G24 -E25+025 -E26+G26 NPV(Keq,H11:26) Help with Excers NPV Function Build the spreadsheet as per image above. Recalculate the intrinsic value of Honda in each of the following scenarios by using the three-stage growth model. Treat each scenario independently. a. ROE in the constant-growth period will be 9%. b. Honda's actual beta is 1.0. -PV of CF
Step by Step Solution
★★★★★
3.43 Rating (153 Votes )
There are 3 Steps involved in it
Step: 1
Based on the provided spreadsheet image the task is to recalculate the intrinsic value per share of Honda as follows 1 Predicting Net Income for Years ...
Get Instant Access to Expert-Tailored Solutions
See step-by-step solutions with expert insights and AI powered tools for academic success
Step: 2

Step: 3

Ace Your Homework with AI
Get the answers you need in no time with our AI-driven, step-by-step assistance
Get Started


