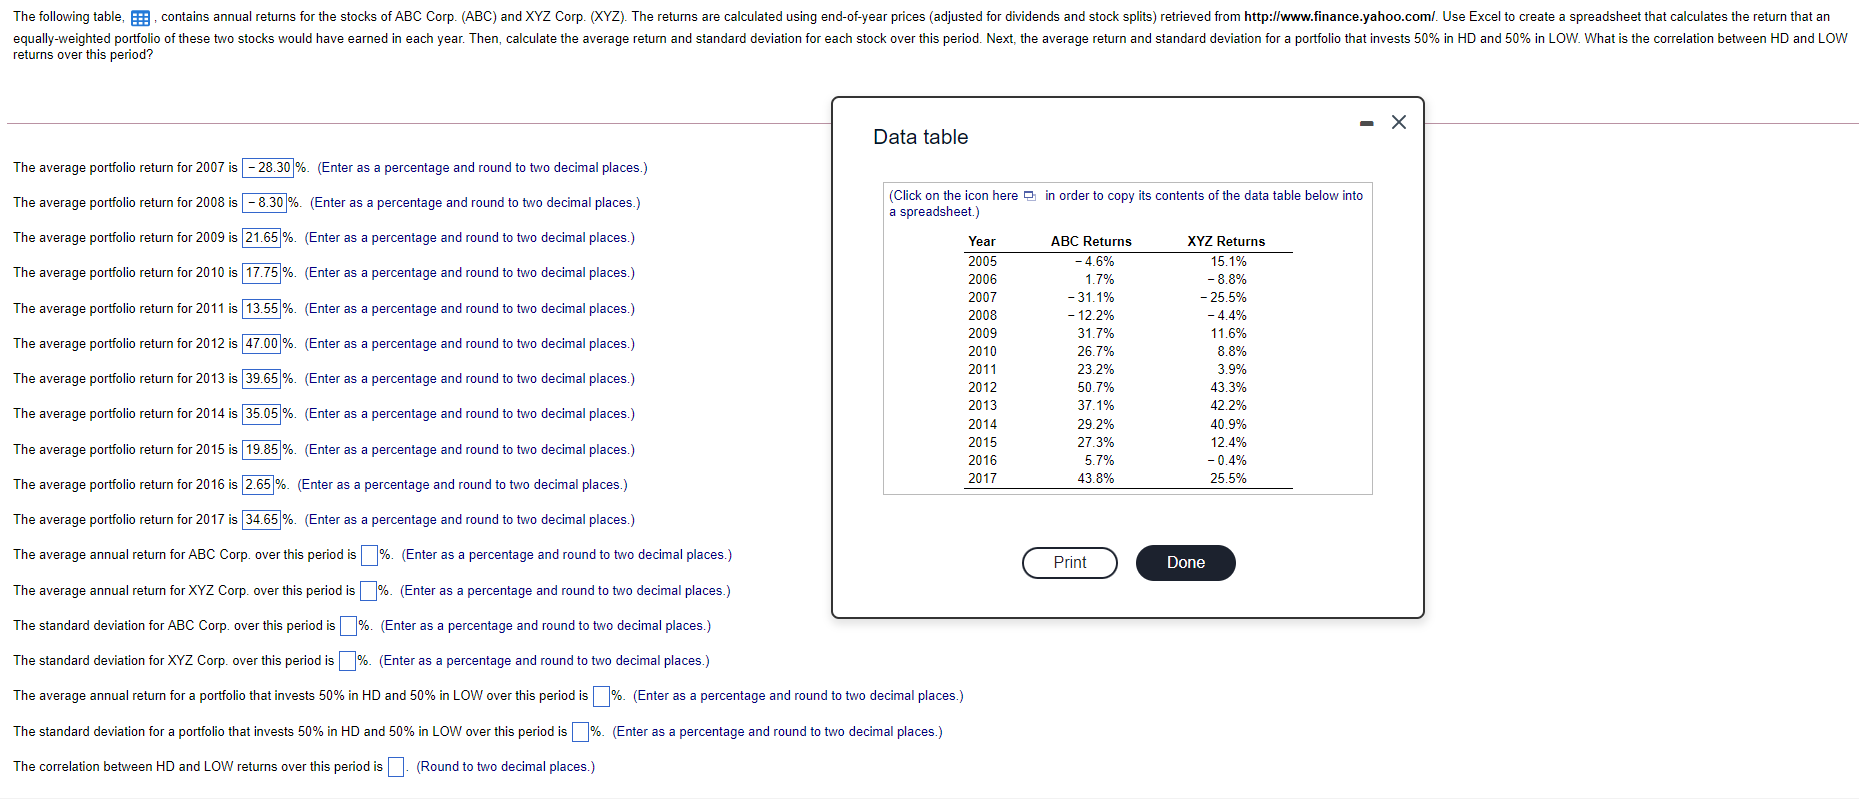
The following table, , contains annual returns for the stocks of ABC Corp. (ABC) and XYZ Corp. (XYZ). The returns are calculated using end-of-year prices (adjusted for dividends and stock splits) retrieved from http://www.finance.yahoo.com/. Use Excel to create a spreadsheet that calculates the return that an equally-weighted portfolio of these two stocks would have earned in each year. Then, calculate the average return and standard deviation for each stock over this period. Next, the average return and standard deviation for a portfolio that invests 50% in HD and 50% in LOW. What is the correlation between HD and LOW returns over this period? Data table The average portfolio return for 2007 is - 28.30 %. (Enter as a percentage and round to two decimal places.) The average portfolio return for 2008 is -8.30 %. (Enter as a percentage and round to two decimal places.) (Click on the icon here in order to copy its contents of the data table below into a spreadsheet.) The average portfolio return for 2009 is 21.65 %. (Enter as a percentage and round to two decimal places.) Year The average portfolio return for 2010 is 17.75 %. (Enter as a percentage and round to two decimal places.) The average portfolio return for 2011 is 13.55%. (Enter as a percentage and round to two decimal places.) The average portfolio return for 2012 is 47.00 %. (Enter as a percentage and round to two decimal places.) 2005 2006 2007 2008 2009 2010 2011 2012 2013 2014 2015 2016 2017 ABC Returns -4.6% 1.7% - 31.1% 12.2% 31.7% 26.7% 23.2% 50.7% 37.1% 29.2% 27.3% 5.7% 43.8% XYZ Returns 15.1% - 8.8% -25.5% -4.4% 11.6% 8.8% 3.9% 43.3% 42.2% 40.9% 12.4% -0.4% 25.5% The average portfolio return for 2013 is 39.65 %. (Enter as a percentage and round to two decimal places.) The average portfolio return for 2014 is 35.05%. (Enter as a percentage and round to two decimal places.) The average portfolio return for 2015 is 19.85 %. (Enter as a percentage and round to two decimal places.) The average portfolio return for 2016 is 2.65%. (Enter as a percentage and round to two decimal places.) The average portfolio return for 2017 is 34.65 %. (Enter as a percentage and round to two decimal places.) Print Done The average annual return for ABC Corp. over this period is %. (Enter as a percentage and round to two decimal places.) The average annual return for XYZ Corp. over this period is %. (Enter as a percentage and round to two decimal places.) The standard deviation for ABC Corp. over this period is %. (Enter as a percentage and round to two decimal places.) The standard deviation for XYZ Corp. over this period is %. (Enter as a percentage and round to two decimal places.) The average annual return for a portfolio that invests 50% in HD and 50% in LOW over this period is %. (Enter as a percentage and round to two decimal places.) The standard deviation for a portfolio that invests 50% in HD and 50% in LOW over this period is %. (Enter as a percentage and round to two decimal places.) The correlation between HD and LOW returns over this period is (Round to two decimal places.)