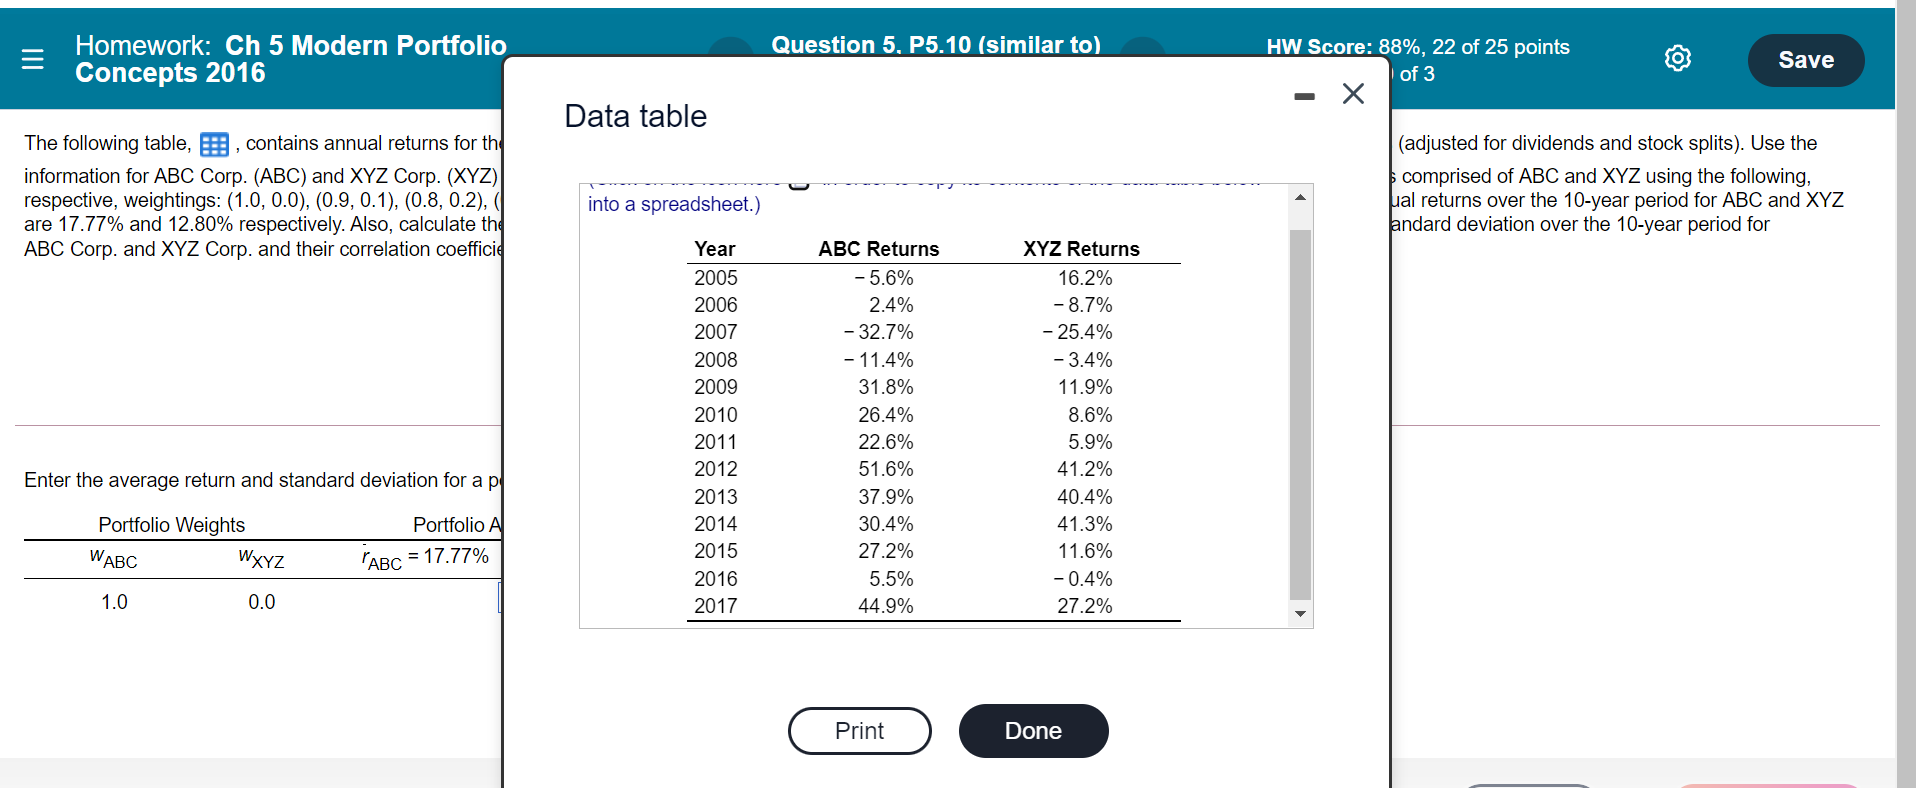

The following table, contains annual returns for the stocks of ABC Corp. (ABC) and XYZ Corp. (XYZ). The returns are calculated using end-of-year prices (adjusted for dividends and stock splits). Use the information for ABC Corp. (ABC) and XYZ Corp. (XYZ) to create an Excel spreadsheet that calculates the average returns over the 10-year period for portfolios comprised of ABC and XYZ using the following, respective, weightings: (1.0, 0.0), (0.9, 0.1), (0.8, 0.2), (0.7, 0.3), (0.6, 0.4), (0.5, 0.5), (0.4, 0.6), (0.3, 0.7), (0.2, 0.8), (0.1, 0.9), and (0.0, 1.0). The average annual returns over the 10-year period for ABC and XYZ are 17.77% and 12.80% respectively. Also, calculate the portfolio standard deviation over the 10-year period associated with each portfolio composition. The standard deviation over the 10-year period for ABC Corp. and XYZ Corp. and their correlation coefficient are 24.43%, 20.46%, and 0.83361 respectively. (Hint: Review Table 5.2.) Enter the average return and standard deviation for a portfolio with 100% ABC Corp. and 0% XYZ Corp. in the table below. (Round to two decimal places.) Portfolio Standard Deviation Portfolio Weights WABC WXYZ Portfolio Average Return "ABC = 17.77% rxyz = 12.80% % 1.0 0.0 % Question 5, P5.10 (similar to) Homework: Ch 5 Modern Portfolio Concepts 2016 Save HW Score: 88%, 22 of 25 points of 3 Data table The following table, B, contains annual returns for the information for ABC Corp. (ABC) and XYZ Corp. (XYZ) respective, weightings: (1.0, 0.0), (0.9, 0.1), (0.8, 0.2), ( are 17.77% and 12.80% respectively. Also, calculate the ABC Corp. and XYZ Corp. and their correlation coefficiel (adjusted for dividends and stock splits). Use the comprised of ABC and XYZ using the following, ual returns over the 10-year period for ABC and XYZ andard deviation over the 10-year period for into a spreadsheet.) Year 2005 2006 2007 2008 2009 2010 2011 2012 2013 2014 2015 2016 2017 ABC Returns -5.6% 2.4% - 32.7% - 11.4% 31.8% 26.4% 22.6% 51.6% 37.9% 30.4% 27.2% 5.5% 44.9% XYZ Returns 16.2% -8.7% -25.4% -3.4% 11.9% 8.6% 5.9% 41.2% 40.4% 41.3% 11.6% -0.4% 27.2% Enter the average return and standard deviation for a pl Portfolio Al Portfolio Weights WABC WXYZ 'ABC = 17.77% 1.0 0.0 Print Done


