

Question
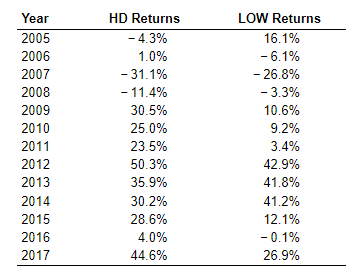
The following table, contains annual returns for the stocks of Home Depot (HD) and Lowe's (LOW). The returns are calculated using end-of-year prices (adjusted for
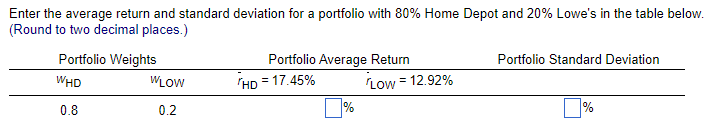
The following table, contains annual returns for the stocks of Home Depot (HD) and Lowe's (LOW). The returns are calculated using end-of-year prices (adjusted for dividends and stock splits). Use the information for Home Depot (HD) and Lowe's (LOW) to create an Excel spreadsheet that calculates the average returns over the 10-year period for portfolios comprised of HD and LOW using the following, respective, weightings: (1.0, 0.0), (0.9, 0.1), (0.8, 0.2), (0.7, 0.3), (0.6, 0.4), (0.5, 0.5), (0.4, 0.6), (0.3, 0.7), (0.2, 0.8), (0.1, 0.9), and (0.0, 1.0). The average annual returns over the 10-year period for HD and LOW are 17.45% and 12.92% respectively. Also, calculate the portfolio standard deviation over the 10-year period associated with each portfolio composition. The standard deviation over the 10-year period for Home Depot and Lowe's and their correlation coefficient are 23.84%, 20.86%, and 0.82105 respectively.
Having a lot of trouble with this one. Please show work. Thank you.
\begin{tabular}{crc} Year & HD Returns & LOW Returns \\ \hline 2005 & 4.3% & 16.1% \\ 2006 & 1.0% & 6.1% \\ 2007 & 31.1% & 26.8% \\ 2008 & 11.4% & 3.3% \\ 2009 & 30.5% & 10.6% \\ 2010 & 25.0% & 9.2% \\ 2011 & 23.5% & 3.4% \\ 2012 & 50.3% & 42.9% \\ 2013 & 35.9% & 41.8% \\ 2014 & 30.2% & 41.2% \\ 2015 & 28.6% & 12.1% \\ 2016 & 4.0% & 0.1% \\ 2017 & 44.6% & 26.9% \\ \hline \end{tabular} Enter the average return and standard deviation for a portfolio with 80% Home Depot and 20% Lowe's in the table below. (Round to two decimal places.)Step by Step Solution
There are 3 Steps involved in it
Step: 1

Get Instant Access to Expert-Tailored Solutions
See step-by-step solutions with expert insights and AI powered tools for academic success
Step: 2

Step: 3
Ace Your Homework with AI
Get the answers you need in no time with our AI-driven, step-by-step assistance
Get Started
Development Finance In China Theory And Implementation Enrich Series On Development Finance In China Volume 1
Authors: Enrich Professional Publishing
1st Edition
9814298107, 9814298115, 9789814298117