

Answered step by step
Verified Expert Solution
Question
1 Approved Answer
The following table contains monthly returns for Cola Co. and Gas Co. for 2010 (the returns are shown in decimal form, i.e., 0.035 is 3.5%).
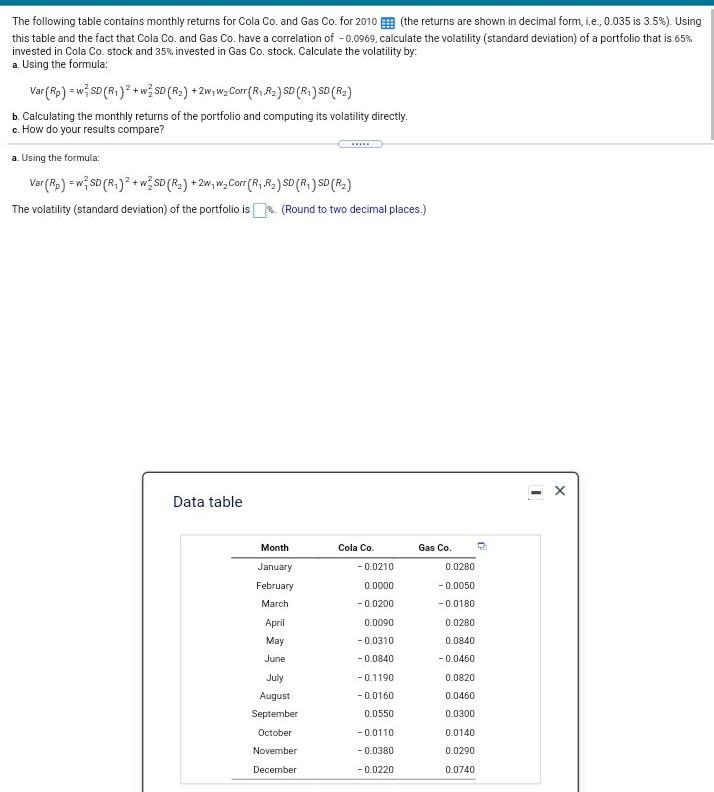
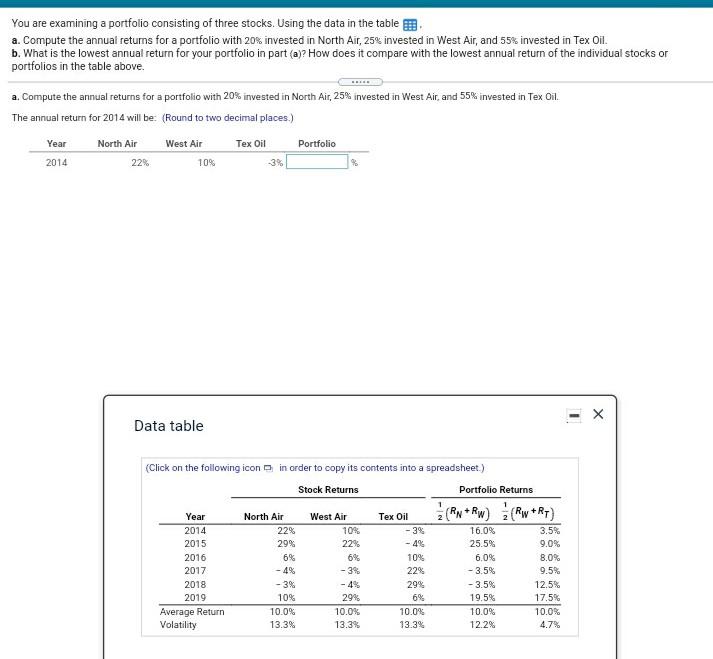
The following table contains monthly returns for Cola Co. and Gas Co. for 2010 (the returns are shown in decimal form, i.e., 0.035 is 3.5%). Using this table and the fact that Cola Co. and Gas Co. have a correlation of -0.0969, calculate the volatility (standard deviation) of a portfolio that is 65% invested in Cola Co stock and 35% invested in Gas Co. stock. Calculate the volatility by a Using the formula: Var (Ro) = w; SD (R.)2 + w SD (R2) +2w,W2 Corr (R, R2} SD (R.) SD (R2) b. Calculating the monthly returns of the portfolio and computing its volatility directly c. How do your results compare? a. Using the formula: Ver (Ro) = w;SD (R.) 2 + w SD (R2) +2w,w, Cort(R, R2) SD (R.) SD (R3) The volatility (standard deviation) of the portfolio is (Round to two decimal places.) x 1 Data table Month Cola Co. Gas Co. -0.0210 0.0280 January February 0.0000 -0.0050 -0.0180 March -00200 April 0.0280 0.0090 -0.0310 May June 0.0840 -0.0460 -0.0840 -0.1190 0.0820 -0.0160 July August September October 0.0460 0.0300 0.0550 -0.0110 -0.0380 0.0140 0.0290 November December -0.0220 0.0740 You are examining a portfolio consisting of three stocks. Using the data in the table a. Compute the annual returns for a portfolio with 20% invested in North Air, 25% invested in West Air, and 55% invested in Tex Oil. b. What is the lowest annual return for your portfolio in part (ay? How does it compare with the lowest annual return of the individual stocks or portfolios in the table above. a. Compute the annual returns for a portfolio with 20% invested in North Air, 25% invested in West Air, and 55% invested in Tex Oil The annual return for 2014 will be: (Round to two decimal places.) North Air West Air Tex Oil Portfolio 22% 10% -3 Year 2014 - Data table (Click on the following icon in order to copy its contents into a spreadsheet.) Stock Returns Portfolio Returns + West Air 10% 22% Year 2014 2015 2016 2017 2018 2019 Average Return Volatility North Air 22% 29% 6% -4% - 3% 10% 10.0% 13.3% -3% - 4% 29% 10.0% 13.3% Tex Oil -3% - 4% 10% 22% 29% 6% 10.0% 13.3% 16.0% 25.5% 6.0% -3.5% -3.5% 19.5% 10.0% 12.2% 3.5% 9.0% 8.0% 9.5% 12.5% 17.5% 10.0% 4.7%
Step by Step Solution
There are 3 Steps involved in it
Step: 1

Get Instant Access to Expert-Tailored Solutions
See step-by-step solutions with expert insights and AI powered tools for academic success
Step: 2

Step: 3
Ace Your Homework with AI
Get the answers you need in no time with our AI-driven, step-by-step assistance
Get Started
Challenging Global Finance
Authors: Elizabeth Friesen
2012th Edition
0230348793, 978-0230348790