

Answered step by step
Verified Expert Solution
Question
1 Approved Answer
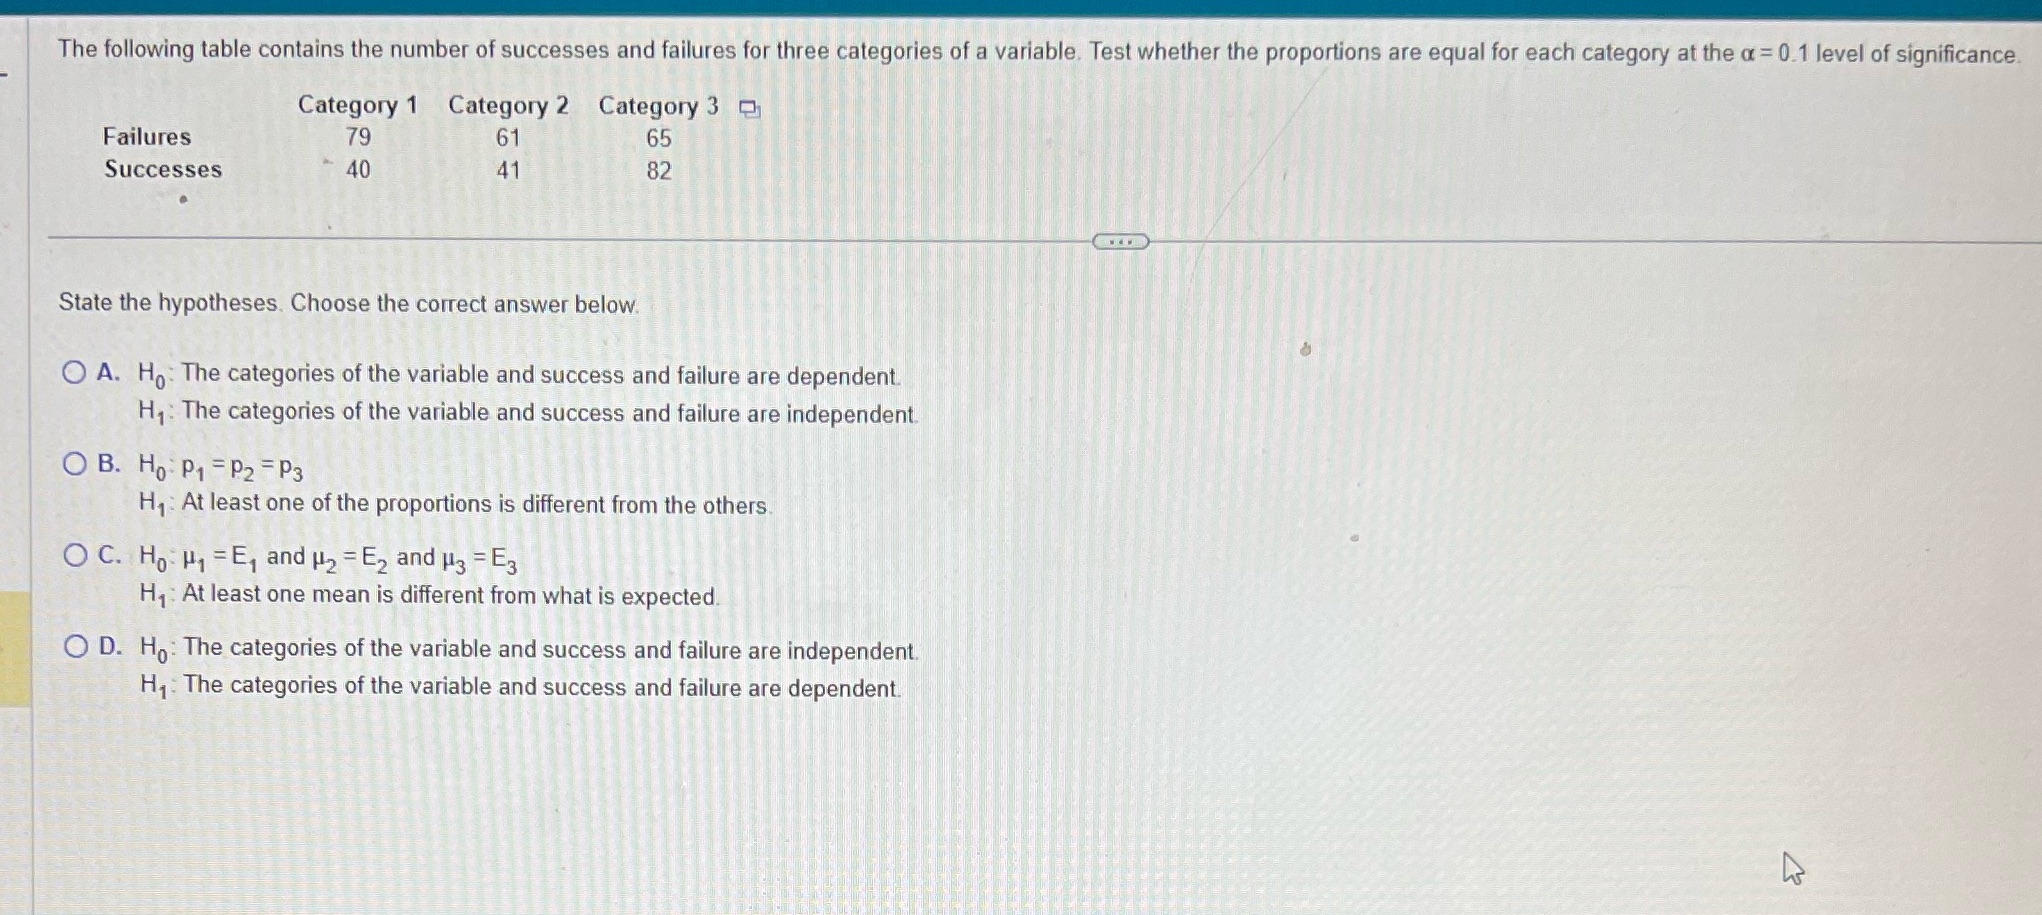
The following table contains the number of successes and failures for three categories of a variable. Test whether the proportions are equal for each category
Step by Step Solution
There are 3 Steps involved in it
Step: 1

Get Instant Access to Expert-Tailored Solutions
See step-by-step solutions with expert insights and AI powered tools for academic success
Step: 2

Step: 3
Ace Your Homework with AI
Get the answers you need in no time with our AI-driven, step-by-step assistance
Get Started
Algebra And Trigonometry Enhanced With Graphing Utilities (Subscription)
Authors: Michael Sullivan, Michael Sullivan III
8th Edition
0135813158, 9780135813157