Answered step by step
Verified Expert Solution
Question
1 Approved Answer
The following table displays a frequency distribution for the number of crew members on each shuttle mission over a 1 0 - year period. Let
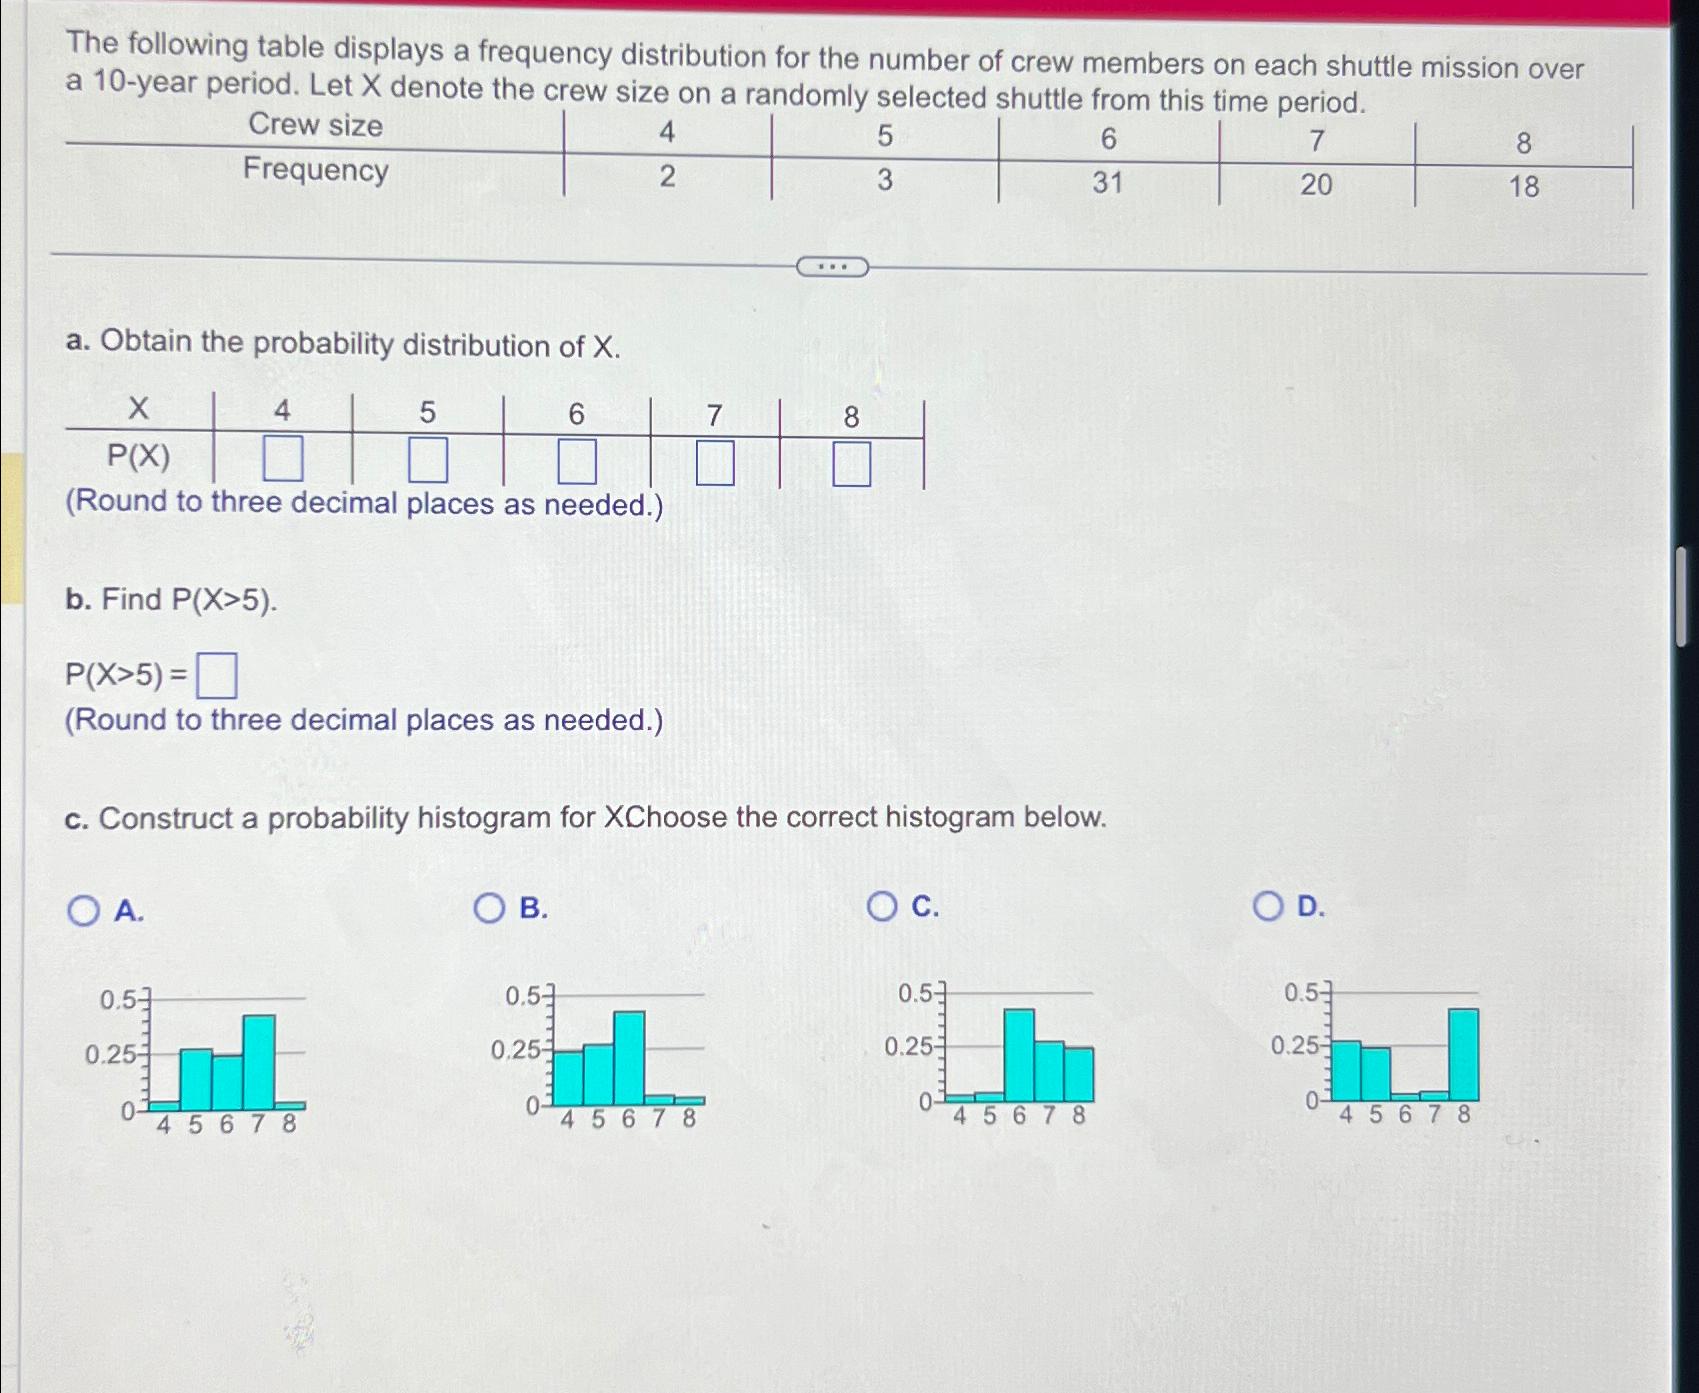
The following table displays a frequency distribution for the number of crew members on each shuttle mission over a year period. Let denote the crew size on a randomly selected shuttle from this time period.
tableCrew size,Frequency
a Obtain the probability distribution of
table
b Find
Round to three decimal places as needed.
c Construct a probability histogram for XChoose the correct histogram below.
A
B
B
C
D

Step by Step Solution
There are 3 Steps involved in it
Step: 1

Get Instant Access to Expert-Tailored Solutions
See step-by-step solutions with expert insights and AI powered tools for academic success
Step: 2

Step: 3

Ace Your Homework with AI
Get the answers you need in no time with our AI-driven, step-by-step assistance
Get Started


