

Answered step by step
Verified Expert Solution
Question
1 Approved Answer
The following table gives information on three risky assets A, B and C Expected|Standard Return % | Deviation 10 Asset Correlation 1.00 0.15 0.21 0.15
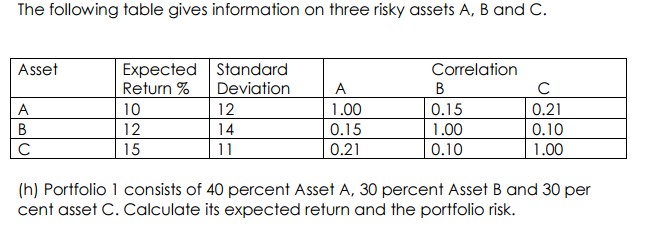
The following table gives information on three risky assets A, B and C Expected|Standard Return % | Deviation 10 Asset Correlation 1.00 0.15 0.21 0.15 1.00 0.10 0.21 0.10 1.00 (h) Portfolio 1 consists of 40 percent Asset A, 30 percent Asset B and 30 per cent asset C. Calculate its expected return and the portfolio risk
Step by Step Solution
There are 3 Steps involved in it
Step: 1

Get Instant Access to Expert-Tailored Solutions
See step-by-step solutions with expert insights and AI powered tools for academic success
Step: 2

Step: 3
Ace Your Homework with AI
Get the answers you need in no time with our AI-driven, step-by-step assistance
Get Started
Financial Times Guide To Finance For Non Financial Managers
Authors: Jo Haigh
1st Edition
0273756206, 978-0273756200