

Answered step by step
Verified Expert Solution
Question
1 Approved Answer
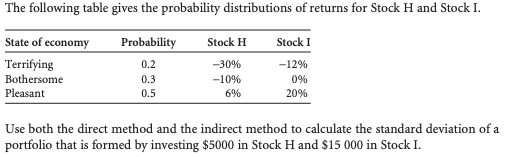
The following table gives the probability distributions of returns for Stock H and Stock I. Stock H Stock I State of economy Terrifying Bothersome Pleasant
Step by Step Solution
There are 3 Steps involved in it
Step: 1

Get Instant Access to Expert-Tailored Solutions
See step-by-step solutions with expert insights and AI powered tools for academic success
Step: 2

Step: 3
Ace Your Homework with AI
Get the answers you need in no time with our AI-driven, step-by-step assistance
Get Started
The Business Credit Handbook
Authors: Mr. Reid A. Nunn
1st Edition
1500542725, 978-1500542726