Question
The following table gives the quantity demanded of ice cream ( Q ic ) in kgs per year in Sardinia (Italy), its price ( P
The following table gives the quantity demanded of ice cream (Qic) in kgs per year in Sardinia (Italy), its price (Pic) in $ per kg, consumers’ income (I) in $, the temperature (T) in Celsius, and the price of cappuccino (Pc) in $ per kg:
Year | Qic | Pic ($/kg) | I($) | T | Pc ($/kg) |
2000 | 72000 | 11 | 2000 | 20 | 14 |
2001 | 81000 | 10 | 2100 | 24 | 15 |
2002 | 90000 | 9 | 2200 | 25 | 15 |
2003 | 99000 | 7 | 2305 | 26 | 16 |
2004 | 108000 | 6 | 2407 | 30 | 17 |
2005 | 126000 | 4 | 2500 | 32 | 18 |
2006 | 117000 | 7 | 2610 | 26 | 16 |
2007 | 117000 | 8 | 2698 | 25 | 16 |
2008 | 135000 | 5 | 2801 | 31 | 18 |
2009 | 135000 | 5 | 2921 | 31 | 18 |
2010 | 144000 | 4 | 3000 | 34 | 20 |
2011 | 180000 | 2 | 3099 | 36 | 21 |
2012 | 162000 | 5 | 3201 | 33 | 19 |
2013 | 171000 | 4 | 3308 | 35 | 21 |
2014 | 153000 | 6 | 3397 | 30 | 18 |
2015 | 180000 | 3 | 3501 | 35 | 22 |
2016 | 171000 | 4 | 3689 | 33 | 20 |
2017 | 180000 | 3 | 3800 | 36 | 23 |
2018 | 198000 | 2 | 3896 | 36 | 25 |
2019 | 189000 | 4 | 3989 | 34 | 23 |
2020 | 175000 | 6 | 3600 | 30 | 18 |
Based on the data provided in the table:
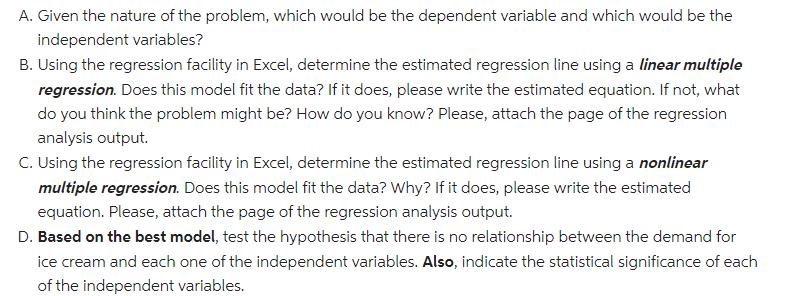
A. Given the nature of the problem, which would be the dependent variable and which would be the independent variables? B. Using the regression facility in Excel, determine the estimated regression line using a linear multiple regression. Does this model fit the data? If it does, please write the estimated equation. If not, what do you think the problem might be? How do you know? Please, attach the page of the regression analysis output. C. Using the regression facility in Excel, determine the estimated regression line using a nonlinear multiple regression. Does this model fit the data? Why? If it does, please write the estimated equation. Please, attach the page of the regression analysis output. D. Based on the best model, test the hypothesis that there is no relationship between the demand for ice cream and each one of the independent variables. Also, indicate the statistical significance of each of the independent variables.
Step by Step Solution
3.33 Rating (147 Votes )
There are 3 Steps involved in it
Step: 1
The correlation matrix is Qic Pic kg I T Pc kg Qic 1 Pic kg 087922 1 I 0959587 076475 1 T 0897531 097299 0796968 1 Pc kg 092076 089823 0880244 0916881 1 We can see that there is strong linear reltions...
Get Instant Access to Expert-Tailored Solutions
See step-by-step solutions with expert insights and AI powered tools for academic success
Step: 2

Step: 3

Ace Your Homework with AI
Get the answers you need in no time with our AI-driven, step-by-step assistance
Get Started


