Question
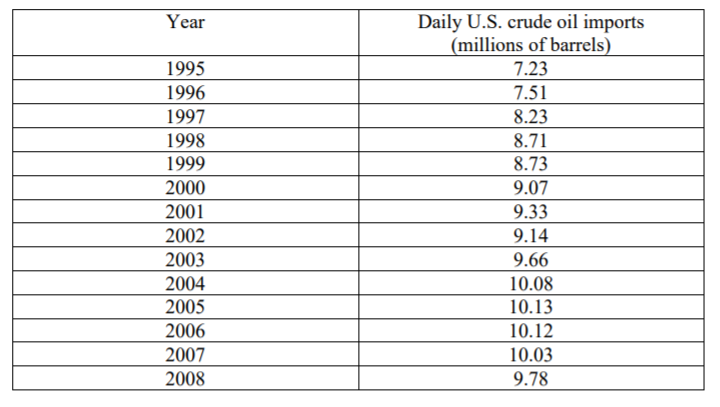
The following table gives the total daily U.S. crude oil imports (in millions of barrels, rounded to the nearest million) for the years 1995 to
The following table gives the total daily U.S. crude oil imports (in millions of barrels, rounded to the nearest million) for the years 1995 to 2008.

(a) Assign a value of 0 to 1995, 1 to 1996, 2 to 1997, and so on. Call this new variable Time. Make a new table with the variables Time and Daily U.S. Crude Oil Imports.
(b) Construct a scatter diagram for these data. Does the scatter diagram exhibit a linear positive relationship between Time and Daily
U.S. Crude Oil Imports?
(c) Estimate the regression equation y a bx = + .
(d) Calculate the correlation coefficient and interpret its value.
(e) Recalculate the correlation coefficient, ignoring the data for 2006, 2007 and 2008. What happens to the value of the correlation coefficient? Create a scatter diagram with time on the horizontal axis and imports on the vertical axis. Use the diagram to explain what happened to the value of the correlation coefficient.
Year 1995 1996 1997 1998 1999 2000 2001 2002 2003 2004 2005 2006 2007 2008 Daily U.S. crude oil imports (millions of barrels) 7.23 7.51 8.23 8.71 8.73 9.07 9.33 9.14 9.66 10.08 10.13 10.12 10.03 9.78 Year 1995 1996 1997 1998 1999 2000 2001 2002 2003 2004 2005 2006 2007 2008 Daily U.S. crude oil imports (millions of barrels) 7.23 7.51 8.23 8.71 8.73 9.07 9.33 9.14 9.66 10.08 10.13 10.12 10.03 9.78
Step by Step Solution
There are 3 Steps involved in it
Step: 1

Get Instant Access to Expert-Tailored Solutions
See step-by-step solutions with expert insights and AI powered tools for academic success
Step: 2

Step: 3

Ace Your Homework with AI
Get the answers you need in no time with our AI-driven, step-by-step assistance
Get Started


