Answered step by step
Verified Expert Solution
Question
1 Approved Answer
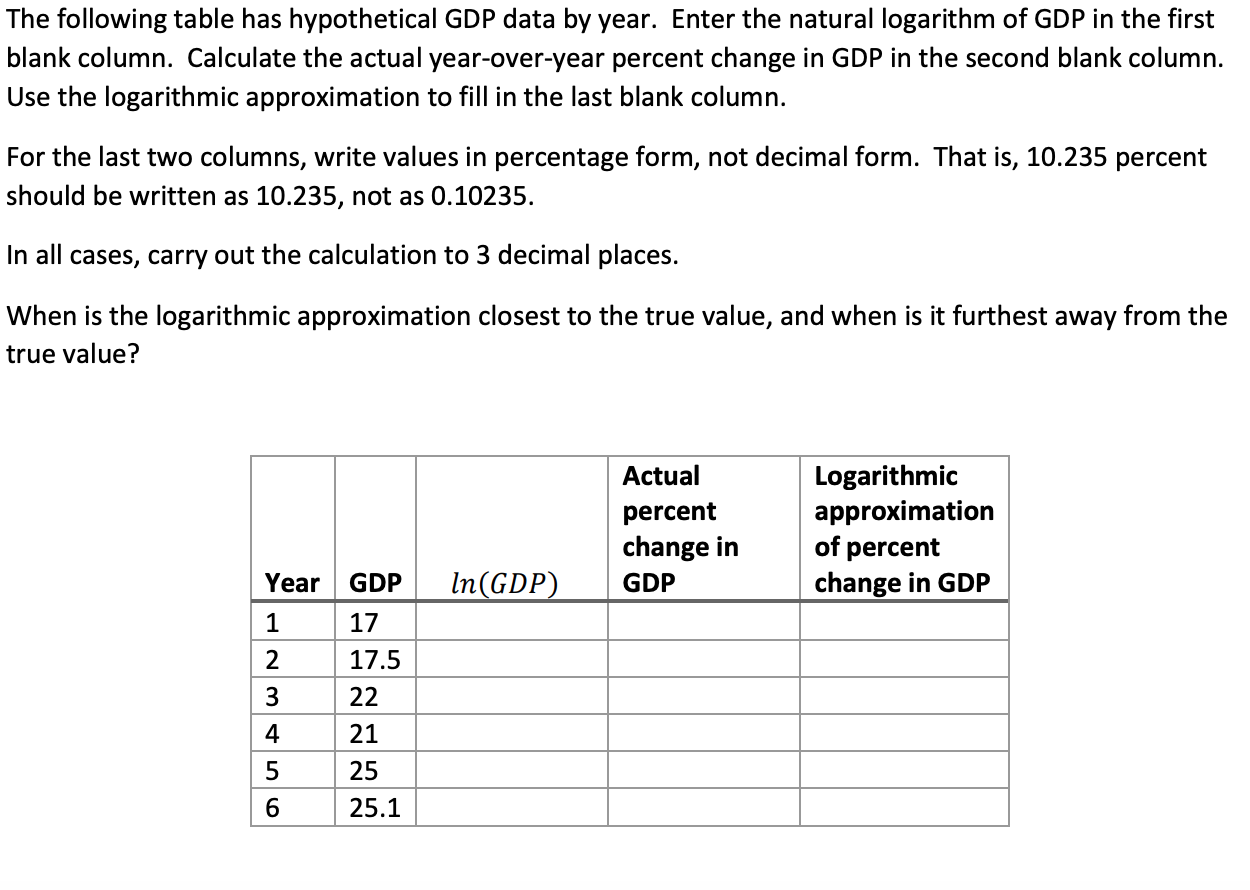
The following table has hypothetical GDP data by year. Enter the natural logarithm of GDP in the first blank column. Calculate the actual year-over-year

The following table has hypothetical GDP data by year. Enter the natural logarithm of GDP in the first blank column. Calculate the actual year-over-year percent change in GDP in the second blank column. Use the logarithmic approximation to fill in the last blank column. For the last two columns, write values in percentage form, not decimal form. That is, 10.235 percent should be written as 10.235, not as 0.10235. In all cases, carry out the calculation to 3 decimal places. When is the logarithmic approximation closest to the true value, and when is it furthest away from the true value? Year 1 2 3 4 5 6 GDP 17 17.5 2222 21 25 25.1 In(GDP) Actual percent change in GDP Logarithmic approximation of percent change in GDP
Step by Step Solution
There are 3 Steps involved in it
Step: 1
Heres the completed table with the natural logarithm of GDP actual yearoveryear percent change in GD...
Get Instant Access to Expert-Tailored Solutions
See step-by-step solutions with expert insights and AI powered tools for academic success
Step: 2

Step: 3

Ace Your Homework with AI
Get the answers you need in no time with our AI-driven, step-by-step assistance
Get Started


