Question
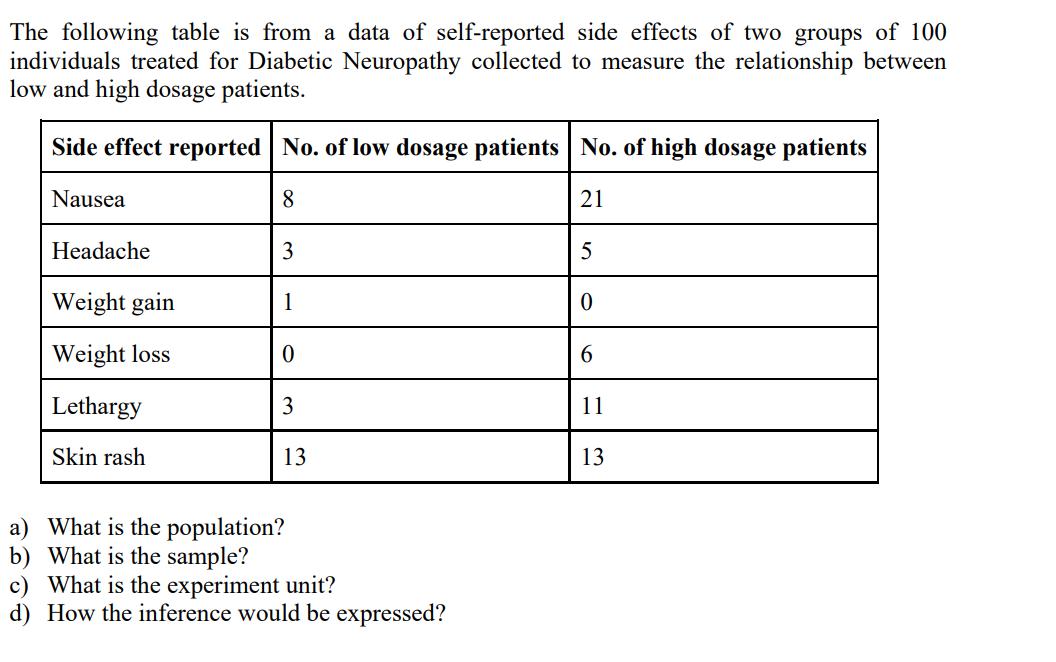
The following table is from a data of self-reported side effects of two groups of 100 individuals treated for Diabetic Neuropathy collected to measure

The following table is from a data of self-reported side effects of two groups of 100 individuals treated for Diabetic Neuropathy collected to measure the relationship between low and high dosage patients. Side effect reported Nausea Headache Weight gain Weight loss Lethargy Skin rash No. of low dosage patients No. of high dosage patients 8 21 3 1 0 3 13 a) What is the population? b) What is the sample? c) What is the experiment unit? d) How the inference would be expressed? 5 0 6 11 13
Step by Step Solution
3.52 Rating (159 Votes )
There are 3 Steps involved in it
Step: 1
The detailed ...
Get Instant Access to Expert-Tailored Solutions
See step-by-step solutions with expert insights and AI powered tools for academic success
Step: 2

Step: 3

Ace Your Homework with AI
Get the answers you need in no time with our AI-driven, step-by-step assistance
Get StartedRecommended Textbook for
Statistics The Art And Science Of Learning From Data
Authors: Alan Agresti, Christine A. Franklin
3rd Edition
9780321849281, 321755944, 321849280, 978-0321755940
Students also viewed these Mathematics questions
Question
Answered: 1 week ago
Question
Answered: 1 week ago
Question
Answered: 1 week ago
Question
Answered: 1 week ago
Question
Answered: 1 week ago
Question
Answered: 1 week ago
Question
Answered: 1 week ago
Question
Answered: 1 week ago
Question
Answered: 1 week ago
Question
Answered: 1 week ago
Question
Answered: 1 week ago
Question
Answered: 1 week ago
Question
Answered: 1 week ago
Question
Answered: 1 week ago
Question
Answered: 1 week ago
Question
Answered: 1 week ago
Question
Answered: 1 week ago
Question
Answered: 1 week ago
Question
Answered: 1 week ago
Question
Answered: 1 week ago
Question
Answered: 1 week ago
Question
Answered: 1 week ago
View Answer in SolutionInn App


