Answered step by step
Verified Expert Solution
Link Copied!

Question

1 Approved Answer

The following table is the result from regression analysis of the relationship between time passage and cash flow from operating activities. As x variable is
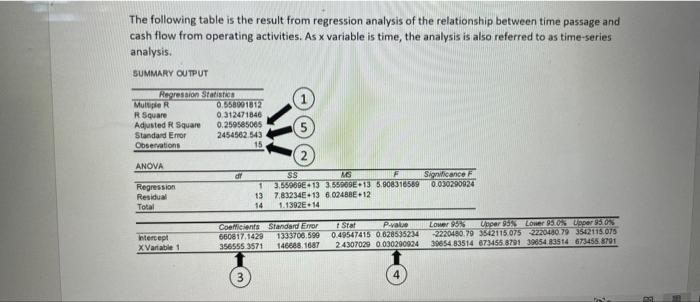
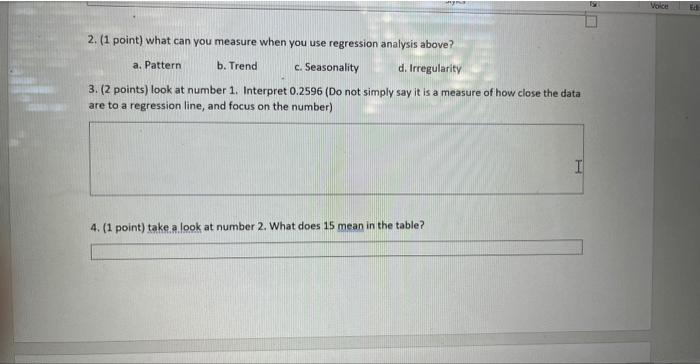
image text in transcribed
The following table is the result from regression analysis of the relationship between time passage and cash flow from operating activities. As x variable is time, the analysis is also referred to as time-series analysis. SUMMARY OUTPUT 2. (1 point) what can you measure when you use regression analysis above? a. Pattern b. Trend c. Seasonality d. Irregularity 3. ( 2 points) look at number 1 . Interpret 0.2596 (Do not simply say it is a measure of how close the data are to a regression line, and focus on the number) 4. (1 point) take a look at number 2 . What does 15 mean in the table

Step by Step Solution

There are 3 Steps involved in it

Step: 1

blur-text-image

Get Instant Access to Expert-Tailored Solutions

See step-by-step solutions with expert insights and AI powered tools for academic success

Step: 2

blur-text-image_2

Step: 3

blur-text-image_3

Ace Your Homework with AI

Get the answers you need in no time with our AI-driven, step-by-step assistance

Get Started

Recommended Textbook for

International financial management

Authors: Jeff Madura

9th Edition

978-0324593495, 324568207, 324568193, 032459349X, 9780324568202, 9780324568196, 978-0324593471

More Books

Students also viewed these Finance questions

Question

=+3. This is a project into which you can sink your teeth.

Answered: 1 week ago

Question

What are the important considerations in target audience selection?

Answered: 1 week ago