Question
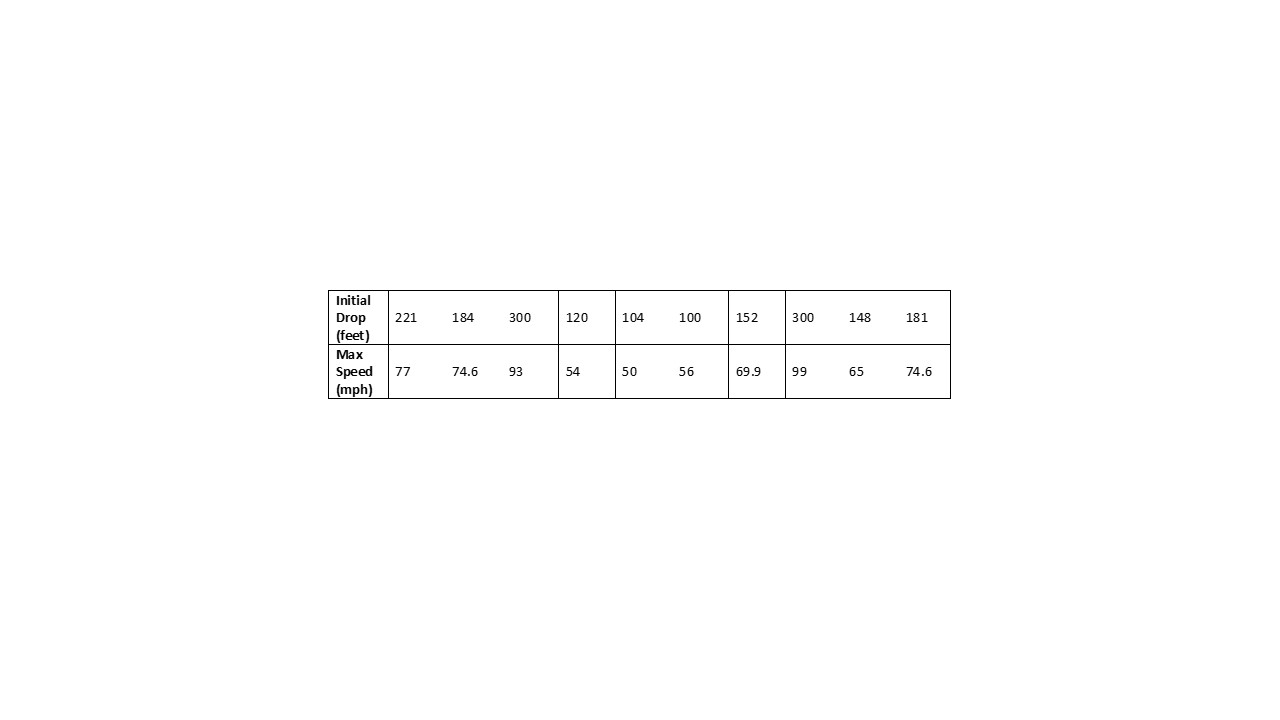
The following table lists the initial drop (in feet) and maximum speed (in mph) of the top 10 ranked roller coasters in the world from
The following table lists the initial drop (in feet) and maximum speed (in mph) of the top 10 ranked roller coasters in the world from the year 2011.
a. Make a rough sketch of the scatter plot for these data. Let Initial Drop be the explanatory variable.
b. Describe the association between initial drop (in feet) and maximum speed for a roller coaster (State various characteristics and reference the correlation coefficient to two decimal places).
c. Write the equation of the regression model. Round values to two decimal places. Clearly define the variables or use variable names in the equation.
d. On the bases of the scatterplot, someone may conclude that the maixmum speed was generally higher for newer roller coasters. Would you agree or disagree? Please explain.

Step by Step Solution
There are 3 Steps involved in it
Step: 1

Get Instant Access to Expert-Tailored Solutions
See step-by-step solutions with expert insights and AI powered tools for academic success
Step: 2

Step: 3

Ace Your Homework with AI
Get the answers you need in no time with our AI-driven, step-by-step assistance
Get Started


