Answered step by step
Verified Expert Solution
Question
1 Approved Answer
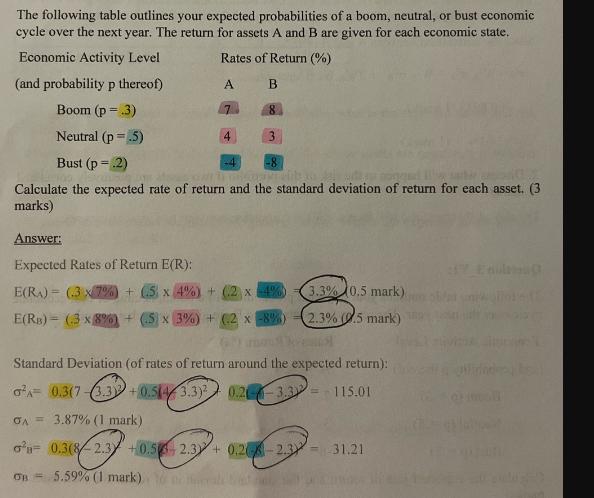
The following table outlines your expected probabilities of a boom, neutral, or bust economic cycle over the next year. The return for assets A

The following table outlines your expected probabilities of a boom, neutral, or bust economic cycle over the next year. The return for assets A and B are given for each economic state. Economic Activity Level Rates of Return (%) (and probability p thereof) A B Boom (p = .3) 8 Neutral (p=.5) 4 3 Bust (p=.2) Calculate the expected rate of return and the standard deviation of return for each asset. (3 marks) Answer: Expected Rates of Return E(R): E(RA) (3x7%) +(5 x 4%) + (2 x 4 %) 3.3% 0.5 mark) E(RB) (3x8%)+(.5 x 3%) + (2x-8%) 2.3% (0.5 mark) Standard Deviation (of rates of return around the expected return): a= 0.3(7-3.32 +0.5(43.3) A=> 3.87% (1 mark) 0.2 -3.3115.01 = 0.3(8-2.3 +0.5 2.3 + 0.2-2.3 31.21 OB = 5.59% (1 mark)
Step by Step Solution
★★★★★
3.41 Rating (160 Votes )
There are 3 Steps involved in it
Step: 1
Expected rate of return Asset A ERA pBoom RABoom pNeutral RANeutra...
Get Instant Access to Expert-Tailored Solutions
See step-by-step solutions with expert insights and AI powered tools for academic success
Step: 2

Step: 3

Document Format ( 2 attachments)
664311f63b16c_952576.pdf
180 KBs PDF File
664311f63b16c_952576.docx
120 KBs Word File
Ace Your Homework with AI
Get the answers you need in no time with our AI-driven, step-by-step assistance
Get Started


