Answered step by step
Verified Expert Solution
Question
1 Approved Answer
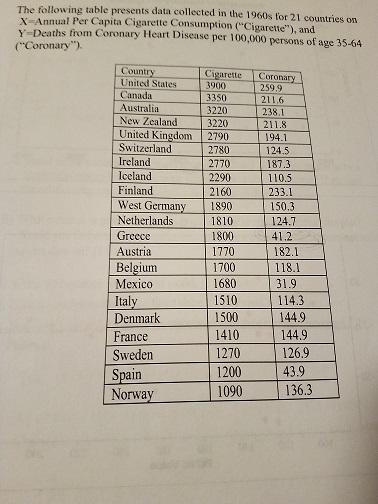
the following table presents data collected in the 1960s for 21 countries on x=annual per capita cigarette consumption (cigarette), and y=deaths from coronary heart disease
the following table presents data collected in the 1960s for 21 countries on x=annual per capita cigarette consumption (“cigarette”), and y=deaths from coronary heart disease per 100,000 persons of age 35-64


The following table presents data collected in the 1960s for 21 countries on X-Annual Per Capita Cigarette Consumption ("Cigarette"), and Y-Deaths from Coronary Heart Disease per 100,000 persons of age 35-64 ("Coronary"). Country United States Cigarette 3900 Coronary 259.9 211.6 238.1 211.8 Canada 3350 3220 Australia New Zealand 3220 2790 United Kingdom Switzerland Ireland Iceland 194.1 2780 124.5 2770 187.3 2290 110.5 Finland West Germany 2160 233.1 1890 150.3 Netherlands 1810 124.7 Greece 1800 41.2 Austria 1770 182.1 Belgium Mexico 1700 118.1 1680 31.9 Italy Denmark 1510 114.3 1500 144.9 France 1410 144.9 Sweden 1270 126.9 1200 43.9 Spain Norway 1090 136.3
Step by Step Solution
★★★★★
3.52 Rating (145 Votes )
There are 3 Steps involved in it
Step: 1
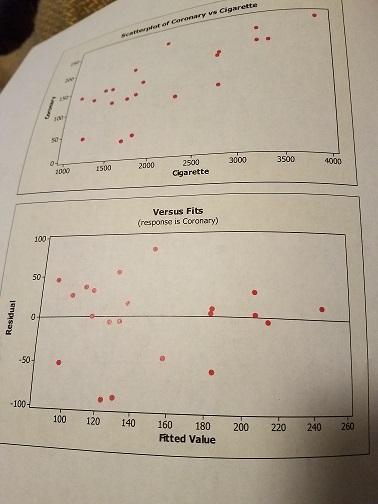
Answer A Based on the scattered plot of coronary vs cigarette we can see that the coronary ...
Get Instant Access to Expert-Tailored Solutions
See step-by-step solutions with expert insights and AI powered tools for academic success
Step: 2

Step: 3

Ace Your Homework with AI
Get the answers you need in no time with our AI-driven, step-by-step assistance
Get Started


