Question
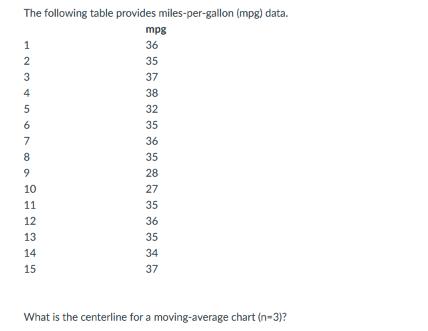
The following table provides miles-per-gallon (mpg) data. 123489 5 6 va 10 11 12 13 14 15 mpg 36 35 37 38 32 35


The following table provides miles-per-gallon (mpg) data. 123489 5 6 va 10 11 12 13 14 15 mpg 36 35 37 38 32 35 36 35 28 27 35 36 35 34 37 What is the centerline for a moving-average chart (n-3)? What is the R (average moving-range)? What is A?
Step by Step Solution
There are 3 Steps involved in it
Step: 1
To calculate the centerline for a movingaverage chart with a sample size of n3 youll first need to calculate the moving averages for the provided data ...
Get Instant Access to Expert-Tailored Solutions
See step-by-step solutions with expert insights and AI powered tools for academic success
Step: 2

Step: 3

Ace Your Homework with AI
Get the answers you need in no time with our AI-driven, step-by-step assistance
Get StartedRecommended Textbook for
Statistics
Authors: Robert S. Witte, John S. Witte
11th Edition
1119254515, 978-1119254515
Students also viewed these Finance questions
Question
Answered: 1 week ago
Question
Answered: 1 week ago
Question
Answered: 1 week ago
Question
Answered: 1 week ago
Question
Answered: 1 week ago
Question
Answered: 1 week ago
Question
Answered: 1 week ago
Question
Answered: 1 week ago
Question
Answered: 1 week ago
Question
Answered: 1 week ago
Question
Answered: 1 week ago
Question
Answered: 1 week ago
Question
Answered: 1 week ago
Question
Answered: 1 week ago
Question
Answered: 1 week ago
Question
Answered: 1 week ago
Question
Answered: 1 week ago
Question
Answered: 1 week ago
Question
Answered: 1 week ago
Question
Answered: 1 week ago
Question
Answered: 1 week ago
View Answer in SolutionInn App


