Question
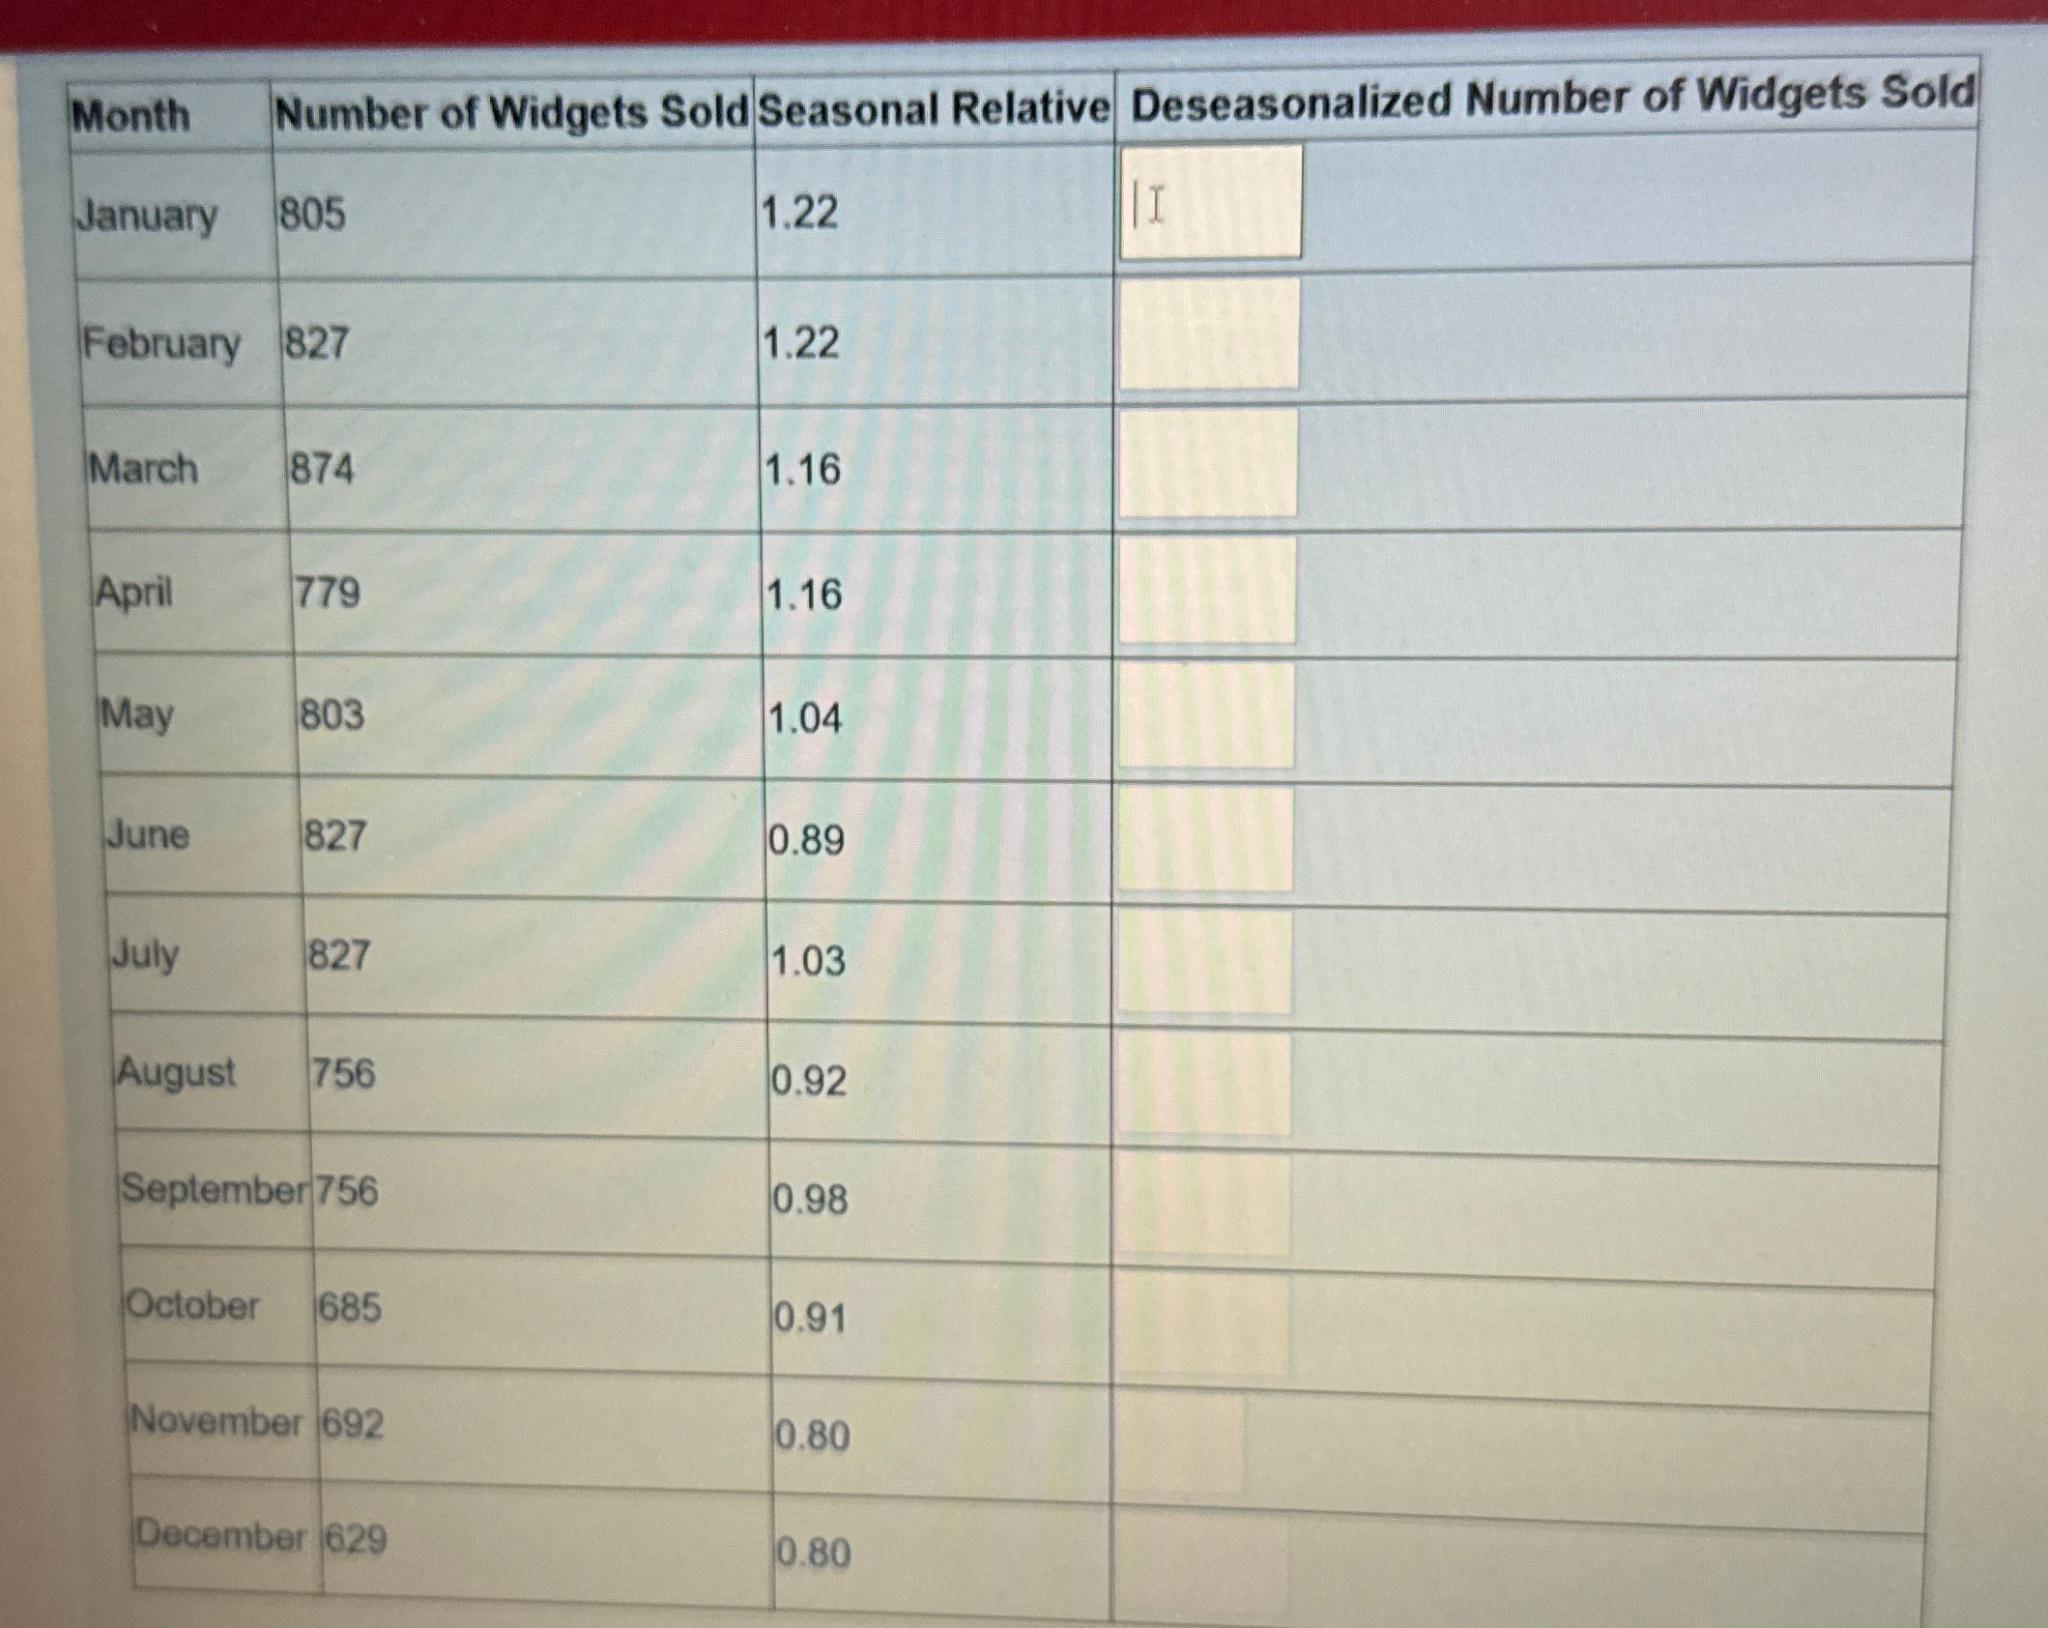
The following table provides sales data for the past year. In addition, it provides monthly seasonal relatives. For each month, use the seasonal relative to
The following table provides sales data for the past year. In addition, it provides monthly seasonal relatives.
For each month, use the seasonal relative to deseasonalize the corresponding data point.

Month Number of Widgets Sold Seasonal Relative Deseasonalized Number of Widgets Sold January 805 1.22 I February 827 1.22 March 874 1.16 April 779 1.16 May 803 1.04 June 827 0.89 July 827 1.03 August 756 0.92 September 756 0.98 October 685 0.91 November 692 0.80 December 629 0.80
Step by Step Solution
There are 3 Steps involved in it
Step: 1

Get Instant Access to Expert-Tailored Solutions
See step-by-step solutions with expert insights and AI powered tools for academic success
Step: 2

Step: 3

Ace Your Homework with AI
Get the answers you need in no time with our AI-driven, step-by-step assistance
Get StartedRecommended Textbook for
Financial Reporting Financial Statement Analysis And Valuation A Strategic Perspective
Authors: James M Wahlen, Stephen P Baginskl, Mark T Bradshaw
7th Edition
9780324789423, 324789416, 978-0324789416
Students also viewed these General Management questions
Question
Answered: 1 week ago
Question
Answered: 1 week ago
Question
Answered: 1 week ago
Question
Answered: 1 week ago
Question
Answered: 1 week ago
Question
Answered: 1 week ago
Question
Answered: 1 week ago
Question
Answered: 1 week ago
Question
Answered: 1 week ago
Question
Answered: 1 week ago
Question
Answered: 1 week ago
Question
Answered: 1 week ago
Question
Answered: 1 week ago
Question
Answered: 1 week ago
Question
Answered: 1 week ago
Question
Answered: 1 week ago
Question
Answered: 1 week ago
Question
Answered: 1 week ago
Question
Answered: 1 week ago
Question
Answered: 1 week ago
Question
Answered: 1 week ago
View Answer in SolutionInn App


