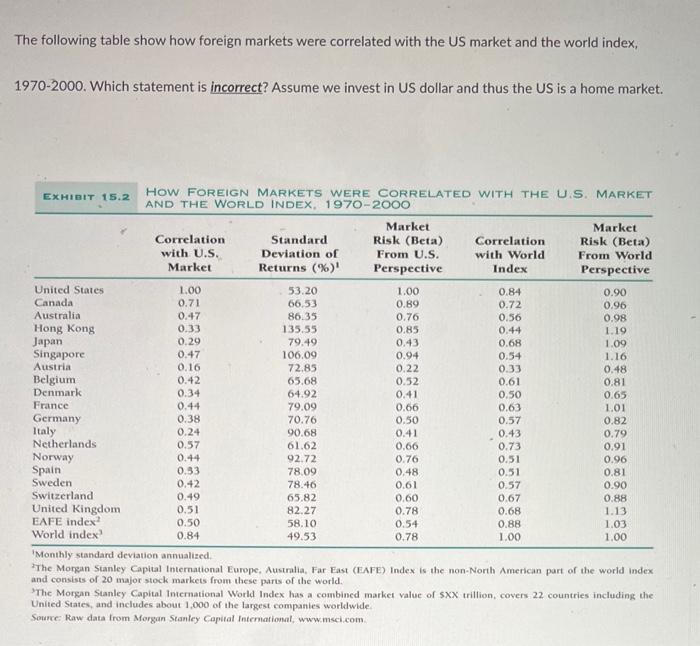
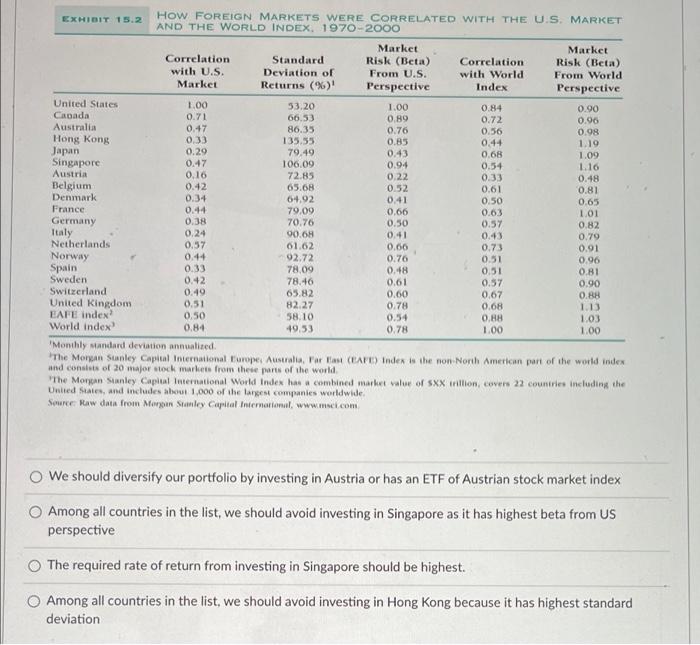
The following table show how foreign markets were correlated with the US market and the world index, 1970-2000. Which statement is incorrect? Assume we invest in US dollar and thus the US is a home market. How FOREIGN MARKETS WERE CORRELATED WITH THE U.S. MARKET EXHIBIT 15.2 AND THE WORLD INDEX, 1970-2000 Market Market Correlation Standard Risk (Beta) Correlation Risk (Beta) with U.S. Deviation of From U.S. with World From World Market Returns (%)' Perspective Index Perspective United States 1.00 53.20 1.00 0.84 0.90 Canada 0.71 66,53 0.89 0.72 0.96 Australia 0.47 86.35 0.76 0.56 0.98 Hong Kong 0.33 135.55 0.85 0.44 1.19 Japan 0.29 79.49 0.43 0.68 1.09 Singapore 0.47 106.09 0.94 0.54 1.16 Austria 0.16 72.85 0.22 0.33 0.48 Belgium 0.42 65.68 0.52 0.61 0.81 Denmark 0.34 64.92 0.41 0.50 0.65 France 0.44 79.09 0.66 0.63 1.01 Germany 0.38 70.76 0.50 0.57 0.82 Italy 0.24 90.68 0.41 0.43 0.79 Netherlands 0.57 61.62 0.66 0.73 0.91 Norway 0.44 92.72 0.76 0.51 0.96 Spain 0.33 78.09 0.48 0.51 0.81 Sweden 0.42 78.46 0.61 0.57 0.90 Switzerland 0.49 65.82 0.60 0.67 0.88 United Kingdom 0.51 82.27 0.78 0.68 1.13 EAFE index? 0.50 58.10 0.54 0.88 1.03 World index 0.84 49.53 0.78 1.00 1.00 Monthly standard deviation annualized The Morgan Stanley Capital International Europe, Australia, Far East (EAFE) Index is the non-North American part of the world index and consists of 20 major stock markets from these parts of the world The Morgan Stanley Capital International World Index has a combined market value of SXX trillion, covers 22 countries including the United States, and includes about 1,000 of the largest companies worldwide Source: Raw data from Morgan Stanley Capital International www.msci.com EXHIBIT 15.2 How FOREIGN MARKETS WERE CORRELATED WITH THE U.S. MARKET AND THE WORLD INDEX: 1970-2000 Market Market Correlation Standard Risk (Beta) Correlation Risk (Beta) with U.S. Deviation of From U.S. with World From World Market Returns (%)' Perspective Index Perspective United States 1.00 53.20 1.00 Canada 0.84 0.90 0.71 66.53 0.89 0.72 0.96 Australia 0.47 86.35 0.76 0.56 0.98 Hong Kong 0,33 135.55 0.85 0.44 1.10 Japan 0.29 79.49 0.43 0.68 1.09 Singapore 0.47 106.09 0.94 0.34 1.10 Austria 0.16 72.85 0.22 0.33 0.48 Belgium 0.42 65.68 0.52 0.61 0.81 Denmark 0.34 64.92 0.41 0.50 0.65 France 0.44 79.09 0.66 0.63 1.01 Germany 0.38 70.76 0.50 0.57 0.82 Italy 0.24 90.6H 0.41 0.43 0.79 Netherlands 0.57 01.02 0.06 0.73 0.01 Norway 0.44 02.72 0.76 0.51 0.96 Spain 0.33 78.09 0.48 0.51 0.81 Sweden 0.42 78.46 0.61 0.57 0.90 Switzerland 0.49 65.82 United Kingdom 0.60 0.67 0.88 0.31 82.27 0.78 0.68 EAFE index 1.13 0.50 58.10 0.54 0.88 1.03 World index 0.84 49,53 0.78 1.00 1.00 Monthly Mandard deviation annualized. The Morgan Sunley Capital International Europe Australia, Far East (EFD) Index is the non North American part of the world index and consists of 20 major stock markets from these parts of the world The Morya Sunley Capital International World Index has a combined market value of 5XX trillion covers 22 countries including the United States, and includes about 1,000 of the largest companies worldwide Source Raw data from Maron Stanley Capital International, www.sci.com We should diversify our portfolio by investing in Austria or has an ETF of Austrian stock market index Among all countries in the list, we should avoid investing in Singapore as it has highest beta from US perspective The required rate of return from investing in Singapore should be highest Among all countries in the list, we should avoid investing in Hong Kong because it has highest standard deviation The following table show how foreign markets were correlated with the US market and the world index, 1970-2000. Which statement is incorrect? Assume we invest in US dollar and thus the US is a home market. How FOREIGN MARKETS WERE CORRELATED WITH THE U.S. MARKET EXHIBIT 15.2 AND THE WORLD INDEX, 1970-2000 Market Market Correlation Standard Risk (Beta) Correlation Risk (Beta) with U.S. Deviation of From U.S. with World From World Market Returns (%)' Perspective Index Perspective United States 1.00 53.20 1.00 0.84 0.90 Canada 0.71 66,53 0.89 0.72 0.96 Australia 0.47 86.35 0.76 0.56 0.98 Hong Kong 0.33 135.55 0.85 0.44 1.19 Japan 0.29 79.49 0.43 0.68 1.09 Singapore 0.47 106.09 0.94 0.54 1.16 Austria 0.16 72.85 0.22 0.33 0.48 Belgium 0.42 65.68 0.52 0.61 0.81 Denmark 0.34 64.92 0.41 0.50 0.65 France 0.44 79.09 0.66 0.63 1.01 Germany 0.38 70.76 0.50 0.57 0.82 Italy 0.24 90.68 0.41 0.43 0.79 Netherlands 0.57 61.62 0.66 0.73 0.91 Norway 0.44 92.72 0.76 0.51 0.96 Spain 0.33 78.09 0.48 0.51 0.81 Sweden 0.42 78.46 0.61 0.57 0.90 Switzerland 0.49 65.82 0.60 0.67 0.88 United Kingdom 0.51 82.27 0.78 0.68 1.13 EAFE index? 0.50 58.10 0.54 0.88 1.03 World index 0.84 49.53 0.78 1.00 1.00 Monthly standard deviation annualized The Morgan Stanley Capital International Europe, Australia, Far East (EAFE) Index is the non-North American part of the world index and consists of 20 major stock markets from these parts of the world The Morgan Stanley Capital International World Index has a combined market value of SXX trillion, covers 22 countries including the United States, and includes about 1,000 of the largest companies worldwide Source: Raw data from Morgan Stanley Capital International www.msci.com EXHIBIT 15.2 How FOREIGN MARKETS WERE CORRELATED WITH THE U.S. MARKET AND THE WORLD INDEX: 1970-2000 Market Market Correlation Standard Risk (Beta) Correlation Risk (Beta) with U.S. Deviation of From U.S. with World From World Market Returns (%)' Perspective Index Perspective United States 1.00 53.20 1.00 Canada 0.84 0.90 0.71 66.53 0.89 0.72 0.96 Australia 0.47 86.35 0.76 0.56 0.98 Hong Kong 0,33 135.55 0.85 0.44 1.10 Japan 0.29 79.49 0.43 0.68 1.09 Singapore 0.47 106.09 0.94 0.34 1.10 Austria 0.16 72.85 0.22 0.33 0.48 Belgium 0.42 65.68 0.52 0.61 0.81 Denmark 0.34 64.92 0.41 0.50 0.65 France 0.44 79.09 0.66 0.63 1.01 Germany 0.38 70.76 0.50 0.57 0.82 Italy 0.24 90.6H 0.41 0.43 0.79 Netherlands 0.57 01.02 0.06 0.73 0.01 Norway 0.44 02.72 0.76 0.51 0.96 Spain 0.33 78.09 0.48 0.51 0.81 Sweden 0.42 78.46 0.61 0.57 0.90 Switzerland 0.49 65.82 United Kingdom 0.60 0.67 0.88 0.31 82.27 0.78 0.68 EAFE index 1.13 0.50 58.10 0.54 0.88 1.03 World index 0.84 49,53 0.78 1.00 1.00 Monthly Mandard deviation annualized. The Morgan Sunley Capital International Europe Australia, Far East (EFD) Index is the non North American part of the world index and consists of 20 major stock markets from these parts of the world The Morya Sunley Capital International World Index has a combined market value of 5XX trillion covers 22 countries including the United States, and includes about 1,000 of the largest companies worldwide Source Raw data from Maron Stanley Capital International, www.sci.com We should diversify our portfolio by investing in Austria or has an ETF of Austrian stock market index Among all countries in the list, we should avoid investing in Singapore as it has highest beta from US perspective The required rate of return from investing in Singapore should be highest Among all countries in the list, we should avoid investing in Hong Kong because it has highest standard deviation


