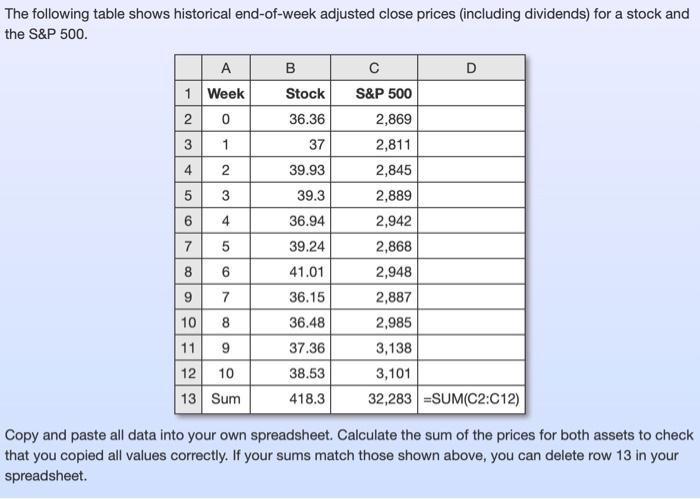
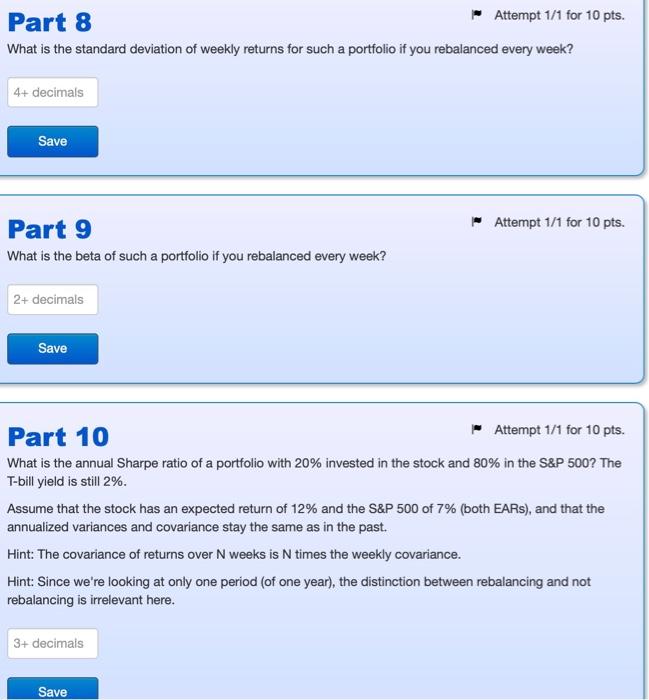
The following table shows historical end-of-week adjusted close prices (including dividends) for a stock and the S&P 500 B D S&P 500 Stock A 1 Week 2 3 1 2 0 36.36 2,869 2,811 37 4 39.93 5 39.3 TAN 6 36.94 39.24 41.01 36.15 7 5 8 6 9 7 10 8 119 12 10 13 Sum 2,845 2,889 2,942 2,868 2,948 2,887 2,985 3,138 3,101 32,283 =SUM(C2C12) 36.48 37.36 38.53 418.3 Copy and paste all data into your own spreadsheet. Calculate the sum of the prices for both assets to check that you copied all values correctly. If your sums match those shown above, you can delete row 13 in your spreadsheet. Part 8 Attempt 1/1 for 10 pts. What is the standard deviation of weekly returns for such a portfolio if you rebalanced every week? 4+ decimals Save Attempt 1/1 for 10 pts. Part 9 What is the beta of such a portfolio if you rebalanced every week? 2+ decimals Save Part 10 Attempt 1/1 for 10 pts. What is the annual Sharpe ratio of a portfolio with 20% invested in the stock and 80% in the S&P 500? The T-bill yield is still 2% Assume that the stock has an expected return of 12% and the S&P 500 of 7% (both EARS), and that the annualized variances and covariance stay the same as in the past. Hint: The covariance of returns over N weeks is N times the weekly covariance. Hint: Since we're looking at only one period (of one year), the distinction between rebalancing and not rebalancing is irrelevant here. 3+ decimals Save The following table shows historical end-of-week adjusted close prices (including dividends) for a stock and the S&P 500 B D S&P 500 Stock A 1 Week 2 3 1 2 0 36.36 2,869 2,811 37 4 39.93 5 39.3 TAN 6 36.94 39.24 41.01 36.15 7 5 8 6 9 7 10 8 119 12 10 13 Sum 2,845 2,889 2,942 2,868 2,948 2,887 2,985 3,138 3,101 32,283 =SUM(C2C12) 36.48 37.36 38.53 418.3 Copy and paste all data into your own spreadsheet. Calculate the sum of the prices for both assets to check that you copied all values correctly. If your sums match those shown above, you can delete row 13 in your spreadsheet. Part 8 Attempt 1/1 for 10 pts. What is the standard deviation of weekly returns for such a portfolio if you rebalanced every week? 4+ decimals Save Attempt 1/1 for 10 pts. Part 9 What is the beta of such a portfolio if you rebalanced every week? 2+ decimals Save Part 10 Attempt 1/1 for 10 pts. What is the annual Sharpe ratio of a portfolio with 20% invested in the stock and 80% in the S&P 500? The T-bill yield is still 2% Assume that the stock has an expected return of 12% and the S&P 500 of 7% (both EARS), and that the annualized variances and covariance stay the same as in the past. Hint: The covariance of returns over N weeks is N times the weekly covariance. Hint: Since we're looking at only one period (of one year), the distinction between rebalancing and not rebalancing is irrelevant here. 3+ decimals Save