Answered step by step
Verified Expert Solution
Question
1 Approved Answer
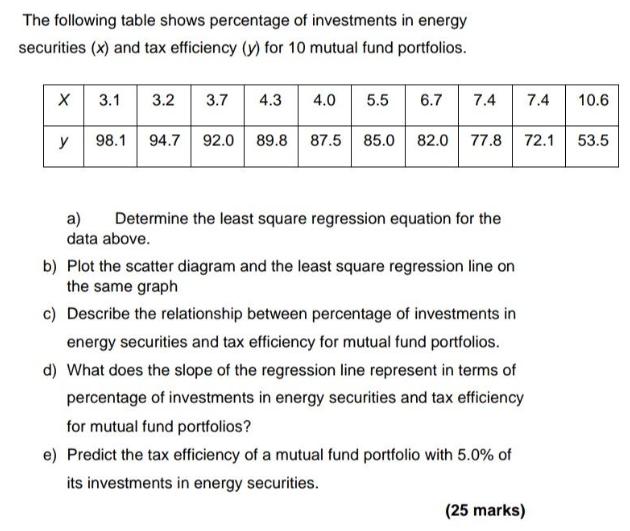
The following table shows percentage of investments in energy securities (x) and tax efficiency (y) for 10 mutual fund portfolios. X y 3.1 3.2

The following table shows percentage of investments in energy securities (x) and tax efficiency (y) for 10 mutual fund portfolios. X y 3.1 3.2 3.7 4.3 4.0 5.5 6.7 7.4 98.1 94.7 92.0 89.8 87.5 85.0 82.0 77.8 72.1 a) Determine the least square regression equation for the data above. b) Plot the scatter diagram and the least square regression line on the same graph c) Describe the relationship between percentage of investments in energy securities and tax efficiency for mutual fund portfolios. d) What does the slope of the regression line represent in terms of percentage of investments in energy securities and tax efficiency for mutual fund portfolios? e) Predict the tax efficiency of a mutual fund portfolio with 5.0% of its investments in energy securities. (25 marks) 7.4 10.6 53.5
Step by Step Solution
★★★★★
3.31 Rating (157 Votes )
There are 3 Steps involved in it
Step: 1
Finances Answer Given data 31 4 981 301 32 307 3 40 55 67 7 744 1006 559 32 ...
Get Instant Access to Expert-Tailored Solutions
See step-by-step solutions with expert insights and AI powered tools for academic success
Step: 2

Step: 3

Ace Your Homework with AI
Get the answers you need in no time with our AI-driven, step-by-step assistance
Get Started


