Answered step by step
Verified Expert Solution
Link Copied!

Question

1 Approved Answer

The following table shows soybean production, in millions of tons, in the United States as a function of the cultivated area, in millions of acres.

image text in transcribed
The following table shows soybean production, in millions of tons, in the United States as a function of the cultivated area, in millions of acres. Find the regression line for the given data and interpret the slope (round coefficients to two decimal places). Give the value of the correlation coefficient. What does that value tell you? Area (millions of acres) 30 42 69 59 74 74 Production (millions of tons) 20 32 51 54 79 81 a. Regression Line: b. Interpretation of slope (what does the value of the slope mean in words): c. Correlation Coefficient: d. What does the correlation coefficient tell you

Step by Step Solution

There are 3 Steps involved in it

Step: 1

blur-text-image

Get Instant Access to Expert-Tailored Solutions

See step-by-step solutions with expert insights and AI powered tools for academic success

Step: 2

blur-text-image_2

Step: 3

blur-text-image_3

Ace Your Homework with AI

Get the answers you need in no time with our AI-driven, step-by-step assistance

Get Started

Recommended Textbook for

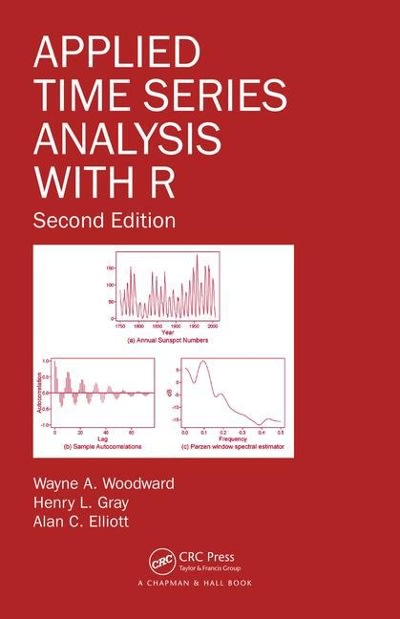
Applied Time Series Analysis With R

Authors: Wayne A Woodward, Henry L Gray, Alan C Elliott

2nd Edition

1498734278, 9781498734271

More Books

Students also viewed these Mathematics questions

Question

What are the key components in valuing a new or growing venture?

Answered: 1 week ago

Question

Name the four objectives of transfer prices. pg26

Answered: 1 week ago

Question

What is the ideal transfer price for cost centers? pg36

Answered: 1 week ago