

Answered step by step
Verified Expert Solution
Question
1 Approved Answer
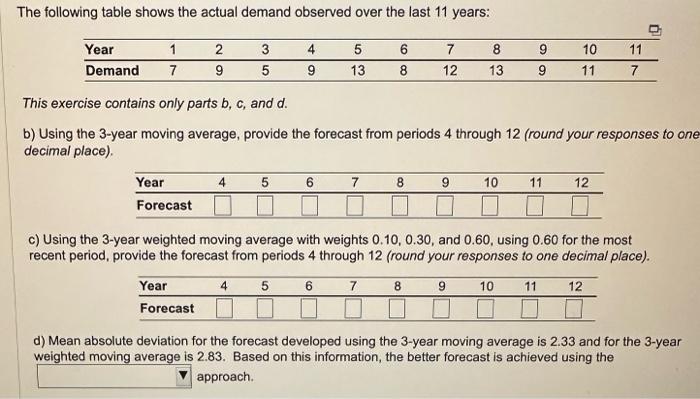
The following table shows the actual demand observed over the last 11 years: This exercise contains only parts b,c, and d. b) Using the 3-year
Step by Step Solution
There are 3 Steps involved in it
Step: 1

Get Instant Access to Expert-Tailored Solutions
See step-by-step solutions with expert insights and AI powered tools for academic success
Step: 2

Step: 3
Ace Your Homework with AI
Get the answers you need in no time with our AI-driven, step-by-step assistance
Get Started
Quantitative Methods For Business
Authors: Donald Waters
5th Edition
273739476, 978-0273739470