

Answered step by step
Verified Expert Solution
Question
1 Approved Answer
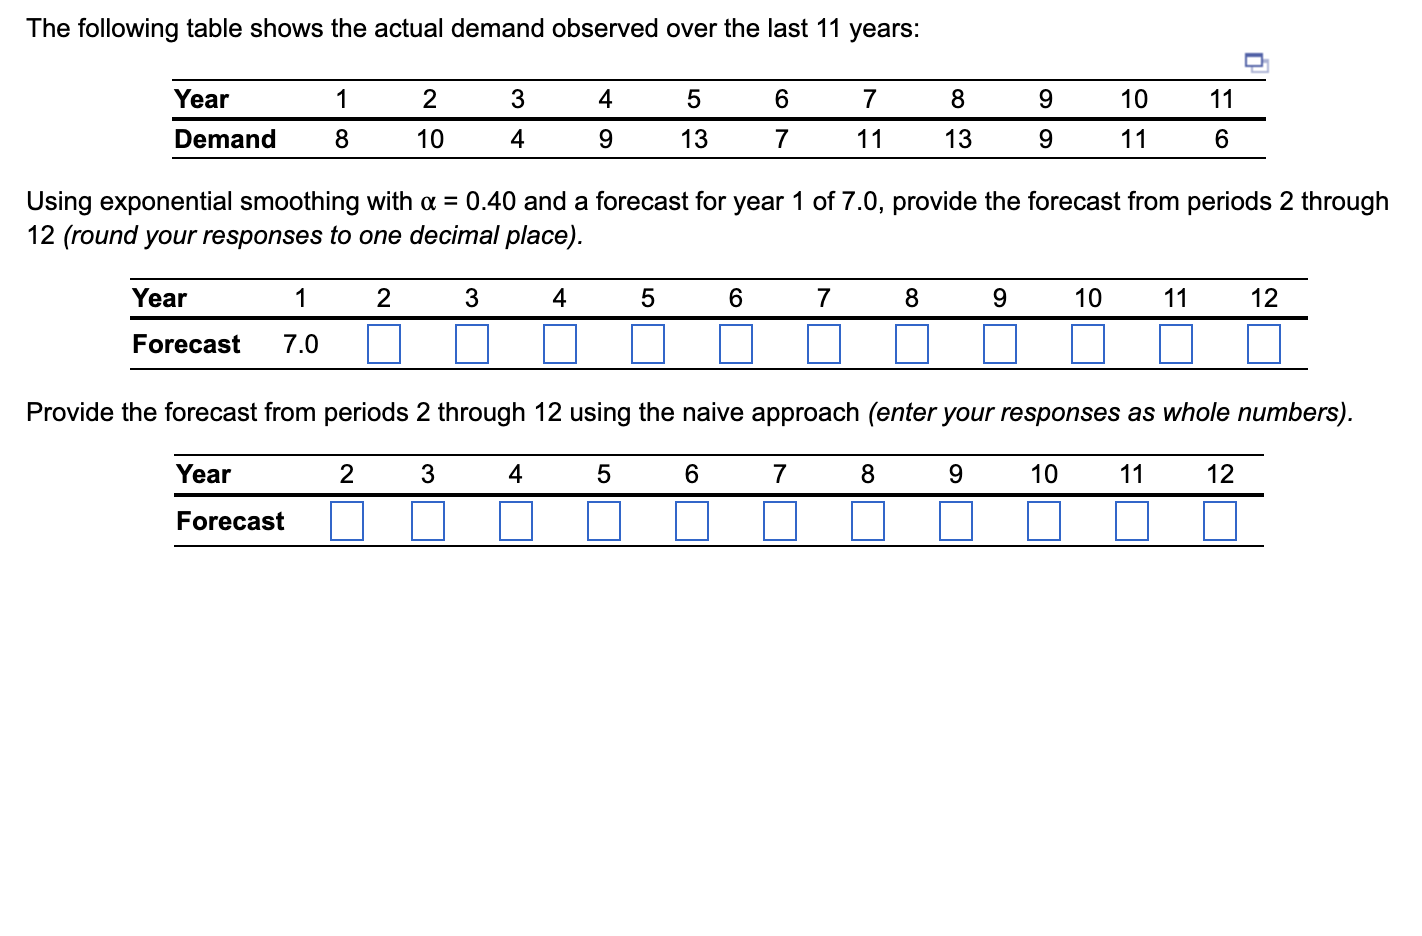
The following table shows the actual demand observed over the last 11 years: Year 2 3 4 5 6 7 8 9 10 11 Demand
Step by Step Solution
There are 3 Steps involved in it
Step: 1

Get Instant Access to Expert-Tailored Solutions
See step-by-step solutions with expert insights and AI powered tools for academic success
Step: 2

Step: 3
Ace Your Homework with AI
Get the answers you need in no time with our AI-driven, step-by-step assistance
Get Started
Information Technology Project Management
Authors: Kathy Schwalbe
6th Edition
978-111122175, 1133172393, 9780324786927, 1111221758, 9781133172390, 324786921, 978-1133153726