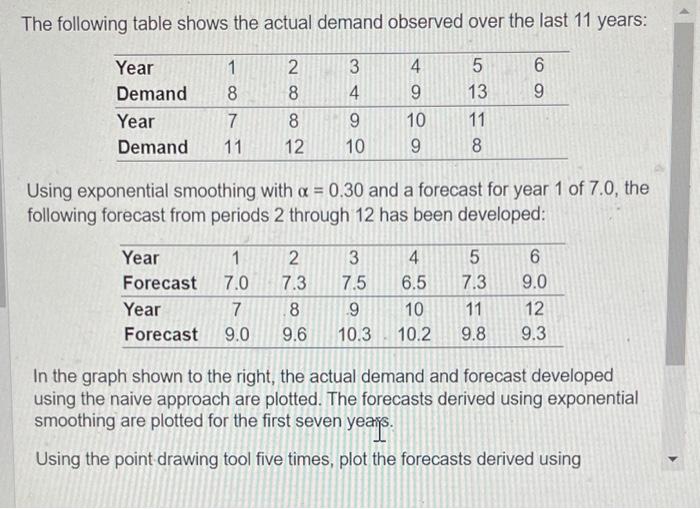
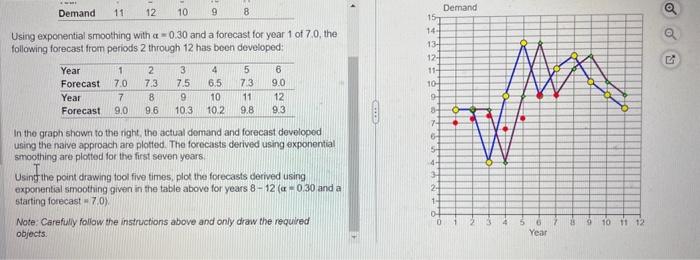
The following table shows the actual demand observed over the last 11 years: Using exponential smoothing with =0.30 and a forecast for year 1 of 7.0, the following forecast from periods 2 through 12 has been developed: In the graph shown to the right, the actual demand and forecast developed using the naive approach are plotted. The forecasts derived using exponential smoothing are plotted for the first seven years. Using the point drawing tool five times, plot the forecasts derived using Using exponential smoothing with =0.30 and a forecast for year 1 of 7.0, the following forecast from periods 2 through 12 has been developed: In the graph shown to the right, the actual demand and forecast developed using the naive approach are plottod. The forecasts derived using exponential smoothing are plotted for the first seven years. Using ihe point drawing tool five times, plok the forecasts derved using exponential smoothing given in the table above for years 812(=0.30 and a starting forecast =7.0 ) Note: Carefuly follow the instructions above and only draw the required objects. The following table shows the actual demand observed over the last 11 years: Using exponential smoothing with =0.30 and a forecast for year 1 of 7.0, the following forecast from periods 2 through 12 has been developed: In the graph shown to the right, the actual demand and forecast developed using the naive approach are plotted. The forecasts derived using exponential smoothing are plotted for the first seven years. Using the point drawing tool five times, plot the forecasts derived using Using exponential smoothing with =0.30 and a forecast for year 1 of 7.0, the following forecast from periods 2 through 12 has been developed: In the graph shown to the right, the actual demand and forecast developed using the naive approach are plottod. The forecasts derived using exponential smoothing are plotted for the first seven years. Using ihe point drawing tool five times, plok the forecasts derved using exponential smoothing given in the table above for years 812(=0.30 and a starting forecast =7.0 ) Note: Carefuly follow the instructions above and only draw the required objects


