

Question
The following table shows the actual demand observed over the last 11 years: Year Demand 1 6 2 8 Year 4 Forecast 6.6 3
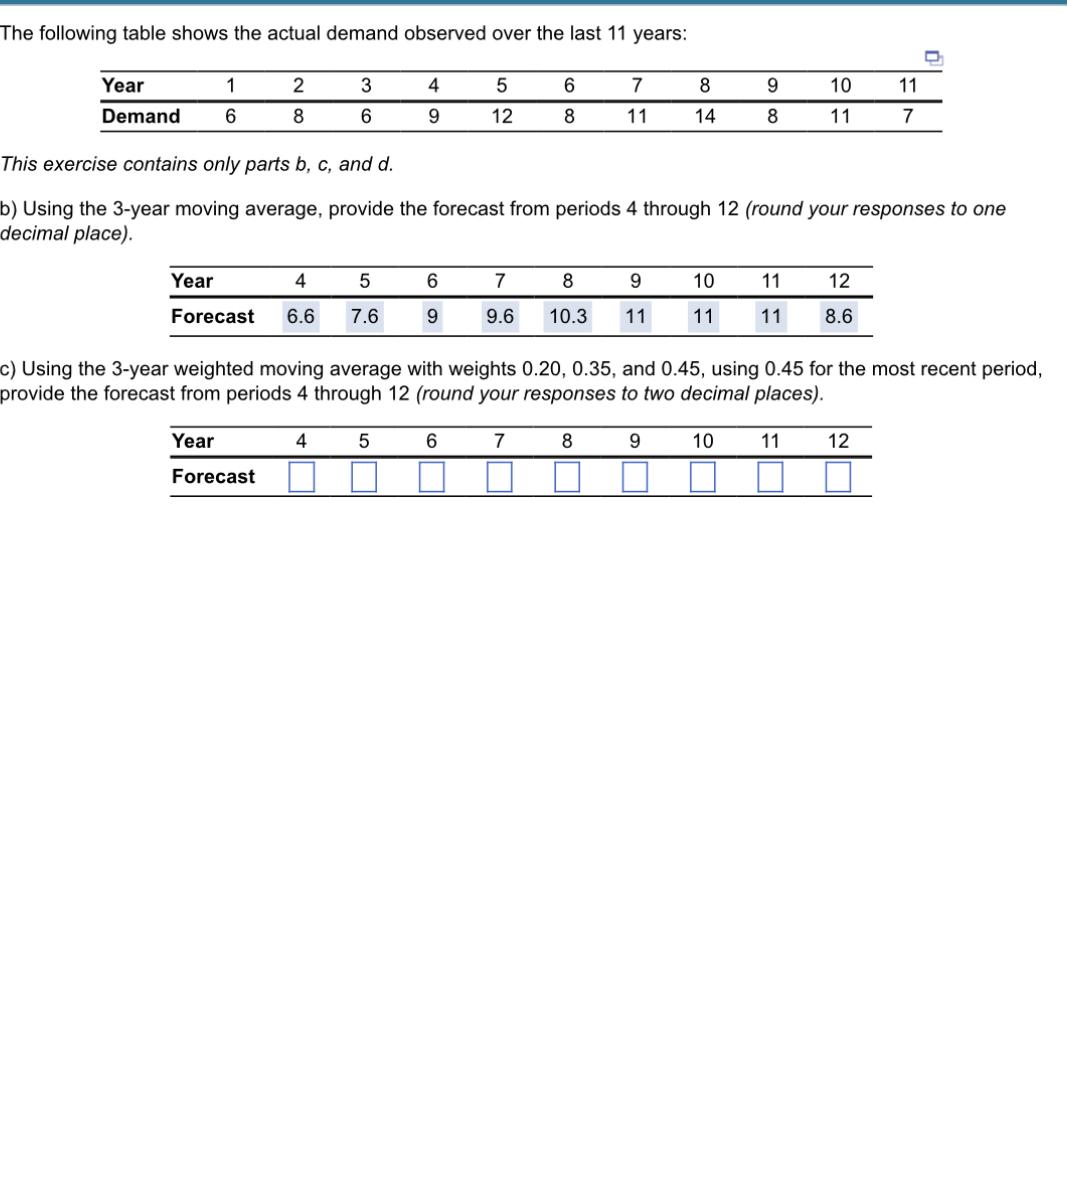
The following table shows the actual demand observed over the last 11 years: Year Demand 1 6 2 8 Year 4 Forecast 6.6 3 6 4 4 9 5 7.6 5 12 6 9 6 8 7 11 7 8 9.6 10.3 This exercise contains only parts b, c, and d. b) Using the 3-year moving average, provide the forecast from periods 4 through 12 (round your responses to one decimal place). 8 14 9 11 9 8 10 11 11 11 10 11 11 12 8.6 11 7 c) Using the 3-year weighted moving average with weights 0.20, 0.35, and 0.45, using 0.45 for the most recent period, provide the forecast from periods 4 through 12 (round your responses to two decimal places). Year 5 6 7 8 9 10 Forecast D 12
Step by Step Solution
There are 3 Steps involved in it
Step: 1
To calculate the 3year weighted moving average with weights of 020 035 and 045 you can follow these ...
Get Instant Access with AI-Powered Solutions
See step-by-step solutions with expert insights and AI powered tools for academic success
Step: 2

Step: 3
Ace Your Homework with AI
Get the answers you need in no time with our AI-driven, step-by-step assistance
Get Started
Income Tax Fundamentals 2013
Authors: Gerald E. Whittenburg, Martha Altus Buller, Steven L Gill
31st Edition
1111972516, 978-1285586618, 1285586611, 978-1285613109, 978-1111972516