

Answered step by step
Verified Expert Solution
Question
1 Approved Answer
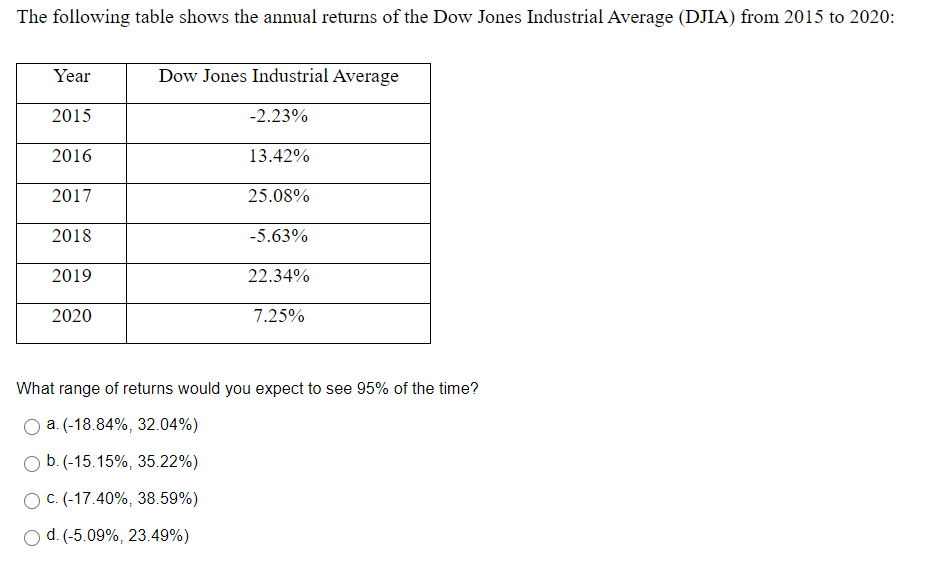
The following table shows the annual returns of the Dow Jones Industrial Average (DJIA) from 2015 to 2020: Year Dow Jones Industrial Average 2015 -2.23%
Step by Step Solution
There are 3 Steps involved in it
Step: 1

Get Instant Access to Expert-Tailored Solutions
See step-by-step solutions with expert insights and AI powered tools for academic success
Step: 2

Step: 3
Ace Your Homework with AI
Get the answers you need in no time with our AI-driven, step-by-step assistance
Get Started
Family Enterprise Understanding Families In Business And Families Of Wealth + Online Assessment Tool
Authors: Family Firm Institute
1st Edition
1118730925,1118730984