Question
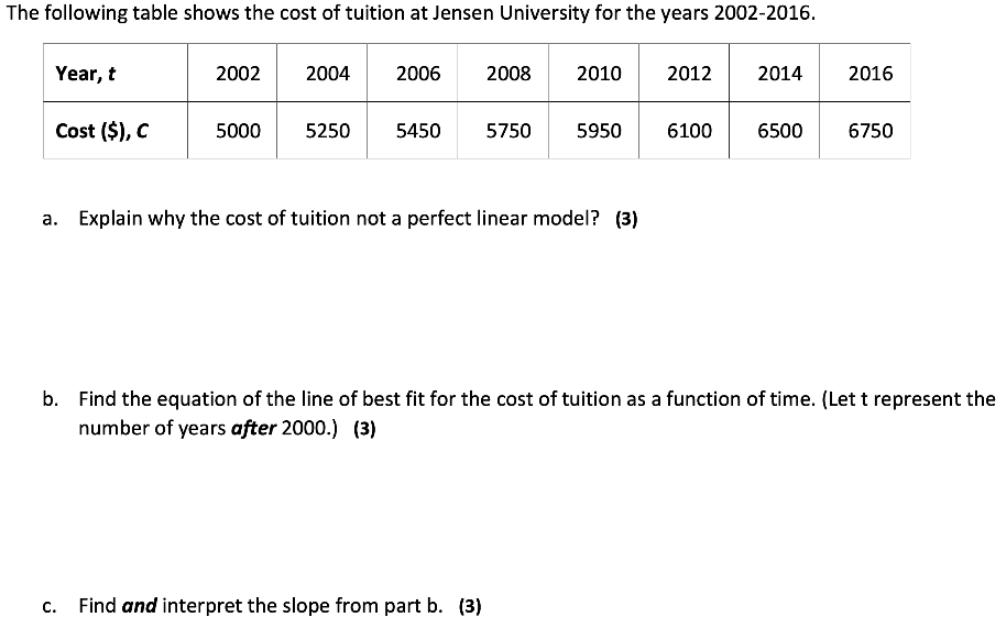
The following table shows the cost of tuition at Jensen University for the years 2002-2016. Year, t Cost ($), C 2002 2004 C. 2006


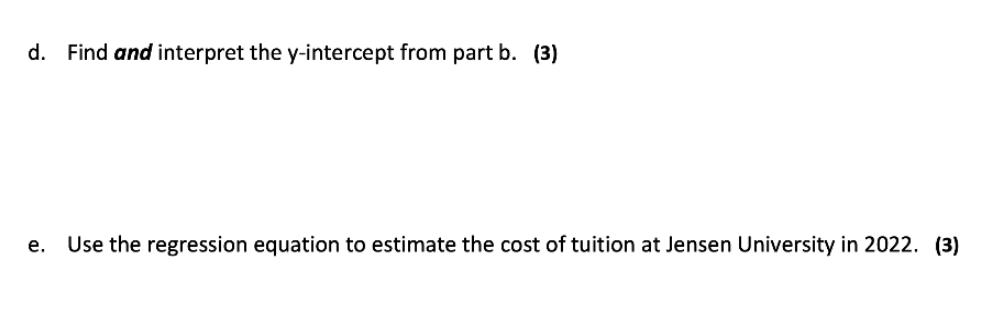
The following table shows the cost of tuition at Jensen University for the years 2002-2016. Year, t Cost ($), C 2002 2004 C. 2006 2008 5000 5250 5450 5750 2010 a. Explain why the cost of tuition not a perfect linear model? (3) Find and interpret the slope from part b. (3) 5950 2012 2014 2016 6100 b. Find the equation of the line of best fit for the cost of tuition as a function of time. (Let t represent the number of years after 2000.) (3) 6500 6750 d. Find and interpret the y-intercept from part b. (3) e. Use the regression equation to estimate the cost of tuition at Jensen University in 2022. (3)
Step by Step Solution
3.40 Rating (159 Votes )
There are 3 Steps involved in it
Step: 1
a Why is the cost of tuition not a perfect linear model Many points are not lying on the line eg 200...
Get Instant Access to Expert-Tailored Solutions
See step-by-step solutions with expert insights and AI powered tools for academic success
Step: 2

Step: 3

Ace Your Homework with AI
Get the answers you need in no time with our AI-driven, step-by-step assistance
Get StartedRecommended Textbook for
Mathematical Applications for the Management Life and Social Sciences
Authors: Ronald J. Harshbarger, James J. Reynolds
11th edition
9781337032247, 9781305465183, 1305108043, 1337032247, 1305465180, 978-1305108042
Students also viewed these Accounting questions
Question
Answered: 1 week ago
Question
Answered: 1 week ago
Question
Answered: 1 week ago
Question
Answered: 1 week ago
Question
Answered: 1 week ago
Question
Answered: 1 week ago
Question
Answered: 1 week ago
Question
Answered: 1 week ago
Question
Answered: 1 week ago
Question
Answered: 1 week ago
Question
Answered: 1 week ago
Question
Answered: 1 week ago
Question
Answered: 1 week ago
Question
Answered: 1 week ago
Question
Answered: 1 week ago
Question
Answered: 1 week ago
Question
Answered: 1 week ago
Question
Answered: 1 week ago
Question
Answered: 1 week ago
Question
Answered: 1 week ago
View Answer in SolutionInn App


