Question
The following table shows the demand for a product produced by a monopolist, who has a constant marginal cost and an average total cost

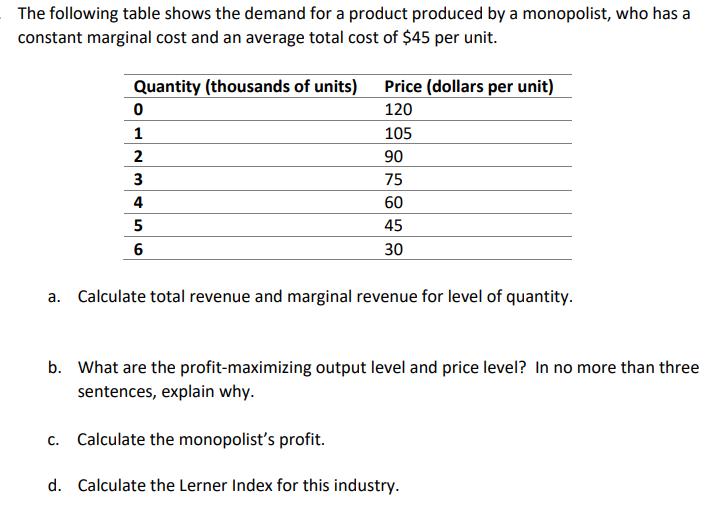
The following table shows the demand for a product produced by a monopolist, who has a constant marginal cost and an average total cost of $45 per unit. Quantity (thousands of units) 0 1 2 3 4 5 6 Price (dollars per unit) 120 105 90 75 60 45 30 a. Calculate total revenue and marginal revenue for level of quantity. b. What are the profit-maximizing output level and price level? In no more than three sentences, explain why. c. Calculate the monopolist's profit. d. Calculate the Lerner Index for this industry.
Step by Step Solution
3.45 Rating (174 Votes )
There are 3 Steps involved in it
Step: 1
a To calculate total revenue we multiply the quantity by the price for each level of quantity Quanti...
Get Instant Access to Expert-Tailored Solutions
See step-by-step solutions with expert insights and AI powered tools for academic success
Step: 2

Step: 3

Ace Your Homework with AI
Get the answers you need in no time with our AI-driven, step-by-step assistance
Get StartedRecommended Textbook for
Calculus Of A Single Variable
Authors: Ron Larson, Bruce H. Edwards
11th Edition
978-1337275361, 9781337275361
Students also viewed these Economics questions
Question
Answered: 1 week ago
Question
Answered: 1 week ago
Question
Answered: 1 week ago
Question
Answered: 1 week ago
Question
Answered: 1 week ago
Question
Answered: 1 week ago
Question
Answered: 1 week ago
Question
Answered: 1 week ago
Question
Answered: 1 week ago
Question
Answered: 1 week ago
Question
Answered: 1 week ago
Question
Answered: 1 week ago
Question
Answered: 1 week ago
Question
Answered: 1 week ago
Question
Answered: 1 week ago
Question
Answered: 1 week ago
Question
Answered: 1 week ago
Question
Answered: 1 week ago
Question
Answered: 1 week ago
Question
Answered: 1 week ago
Question
Answered: 1 week ago
Question
Answered: 1 week ago
Question
Answered: 1 week ago
View Answer in SolutionInn App


