Question
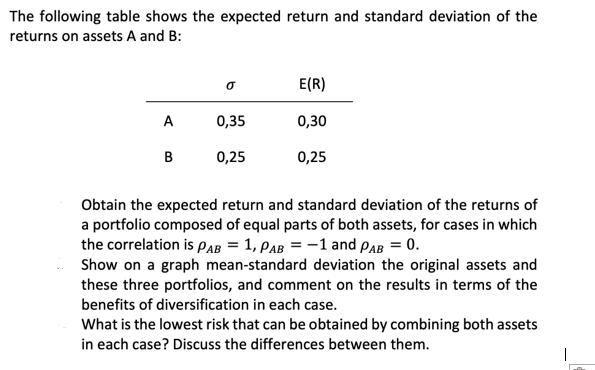
The following table shows the expected return and standard deviation of the returns on assets A and B: A B 0 0,35 0,25 E(R)

The following table shows the expected return and standard deviation of the returns on assets A and B: A B 0 0,35 0,25 E(R) 0,30 0,25 Obtain the expected return and standard deviation of the returns of a portfolio composed of equal parts of both assets, for cases in which the correlation is PAB = 1, PAB = -1 and PAB = 0. Show on a graph mean-standard deviation the original assets and these three portfolios, and comment on the results in terms of the benefits of diversification in each case. What is the lowest risk that can be obtained by combining both assets in each case? Discuss the differences between them.
Step by Step Solution
3.45 Rating (148 Votes )
There are 3 Steps involved in it
Step: 1
Okay here are the steps to solve this problem 1 Given data Asset A ERA 035 A 030 Asset ...
Get Instant Access to Expert-Tailored Solutions
See step-by-step solutions with expert insights and AI powered tools for academic success
Step: 2

Step: 3

Ace Your Homework with AI
Get the answers you need in no time with our AI-driven, step-by-step assistance
Get StartedRecommended Textbook for
Business Statistics In Practice
Authors: Bruce Bowerman, Richard O'Connell
6th Edition
0073401838, 978-0073401836
Students also viewed these Finance questions
Question
Answered: 1 week ago
Question
Answered: 1 week ago
Question
Answered: 1 week ago
Question
Answered: 1 week ago
Question
Answered: 1 week ago
Question
Answered: 1 week ago
Question
Answered: 1 week ago
Question
Answered: 1 week ago
Question
Answered: 1 week ago
Question
Answered: 1 week ago
Question
Answered: 1 week ago
Question
Answered: 1 week ago
Question
Answered: 1 week ago
Question
Answered: 1 week ago
Question
Answered: 1 week ago
Question
Answered: 1 week ago
Question
Answered: 1 week ago
Question
Answered: 1 week ago
Question
Answered: 1 week ago
Question
Answered: 1 week ago
Question
Answered: 1 week ago
View Answer in SolutionInn App


