Question
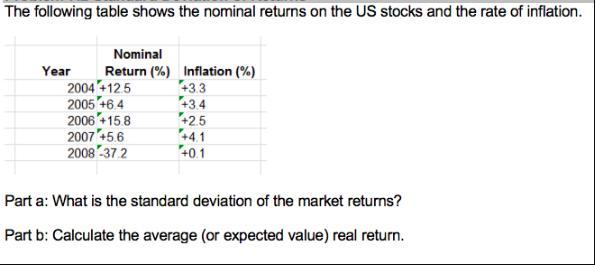
The following table shows the nominal returns on the US stocks and the rate of inflation. Nominal Year 2004 +12.5 Return (%) Inflation (%)

The following table shows the nominal returns on the US stocks and the rate of inflation. Nominal Year 2004 +12.5 Return (%) Inflation (%) +3.3 2005 +6.4 +3.4 2006 +15.8 +2.5 2007 +5.6 +4.1 2008-37.2 +0.1 Part a: What is the standard deviation of the market returns? Part b: Calculate the average (or expected value) real return.
Step by Step Solution
3.46 Rating (156 Votes )
There are 3 Steps involved in it
Step: 1
To calculate the standard deviation of market returns and the average real return we need to adjust ...
Get Instant Access to Expert-Tailored Solutions
See step-by-step solutions with expert insights and AI powered tools for academic success
Step: 2

Step: 3

Ace Your Homework with AI
Get the answers you need in no time with our AI-driven, step-by-step assistance
Get StartedRecommended Textbook for
Business Mathematics In Canada
Authors: Ernest Jerome
7th edition
978-0071091411, 71091416, 978-0070009899
Students also viewed these Economics questions
Question
Answered: 1 week ago
Question
Answered: 1 week ago
Question
Answered: 1 week ago
Question
Answered: 1 week ago
Question
Answered: 1 week ago
Question
Answered: 1 week ago
Question
Answered: 1 week ago
Question
Answered: 1 week ago
Question
Answered: 1 week ago
Question
Answered: 1 week ago
Question
Answered: 1 week ago
Question
Answered: 1 week ago
Question
Answered: 1 week ago
Question
Answered: 1 week ago
Question
Answered: 1 week ago
Question
Answered: 1 week ago
Question
Answered: 1 week ago
Question
Answered: 1 week ago
Question
Answered: 1 week ago
Question
Answered: 1 week ago
Question
Answered: 1 week ago
Question
Answered: 1 week ago
View Answer in SolutionInn App


