

Answered step by step
Verified Expert Solution
Question
1 Approved Answer
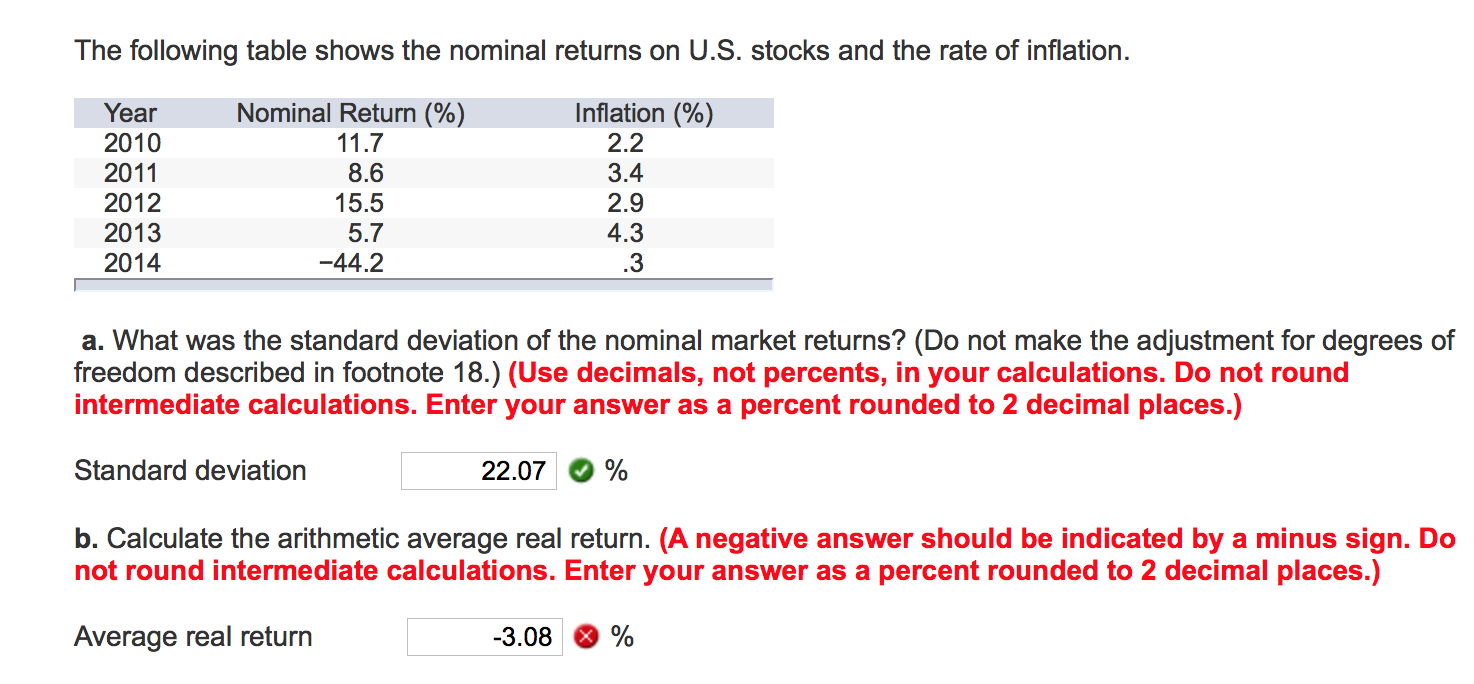
The following table shows the nominal returns on U.S. stocks and the rate of inflation. Year 2010 2011 2012 2013 2014 Nominal Return (%) 11.7
Step by Step Solution
There are 3 Steps involved in it
Step: 1

Get Instant Access to Expert-Tailored Solutions
See step-by-step solutions with expert insights and AI powered tools for academic success
Step: 2

Step: 3
Ace Your Homework with AI
Get the answers you need in no time with our AI-driven, step-by-step assistance
Get Started
Investing All In One
Authors: Eric Tyson
1st Edition
1119376629, 978-1119376620