

Answered step by step
Verified Expert Solution
Question
1 Approved Answer
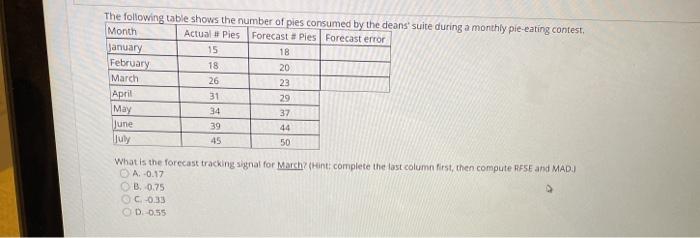
The following table shows the number of pies consumed by the deans' suite during a monthly ple-eating contest. Month Actual Pies Forecast #Pies Forecast error
Step by Step Solution
There are 3 Steps involved in it
Step: 1

Get Instant Access to Expert-Tailored Solutions
See step-by-step solutions with expert insights and AI powered tools for academic success
Step: 2

Step: 3
Ace Your Homework with AI
Get the answers you need in no time with our AI-driven, step-by-step assistance
Get Started
An Introduction To Statistical Sampling In Auditing
Authors: Dan M. Guy
1st Edition
0471042323, 978-0471042327