

Answered step by step
Verified Expert Solution
Question
1 Approved Answer
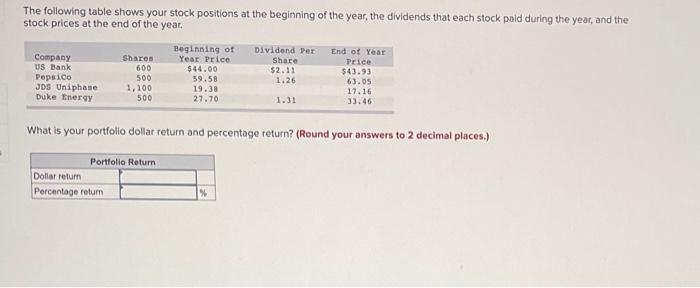
The following table shows your stock positions at the beginning of the year, the dividends that each stock paid during the year, and the stock
Step by Step Solution
There are 3 Steps involved in it
Step: 1

Get Instant Access to Expert-Tailored Solutions
See step-by-step solutions with expert insights and AI powered tools for academic success
Step: 2

Step: 3
Ace Your Homework with AI
Get the answers you need in no time with our AI-driven, step-by-step assistance
Get Started
The Business Credit Handbook
Authors: Mr. Reid A. Nunn
1st Edition
1500542725, 978-1500542726