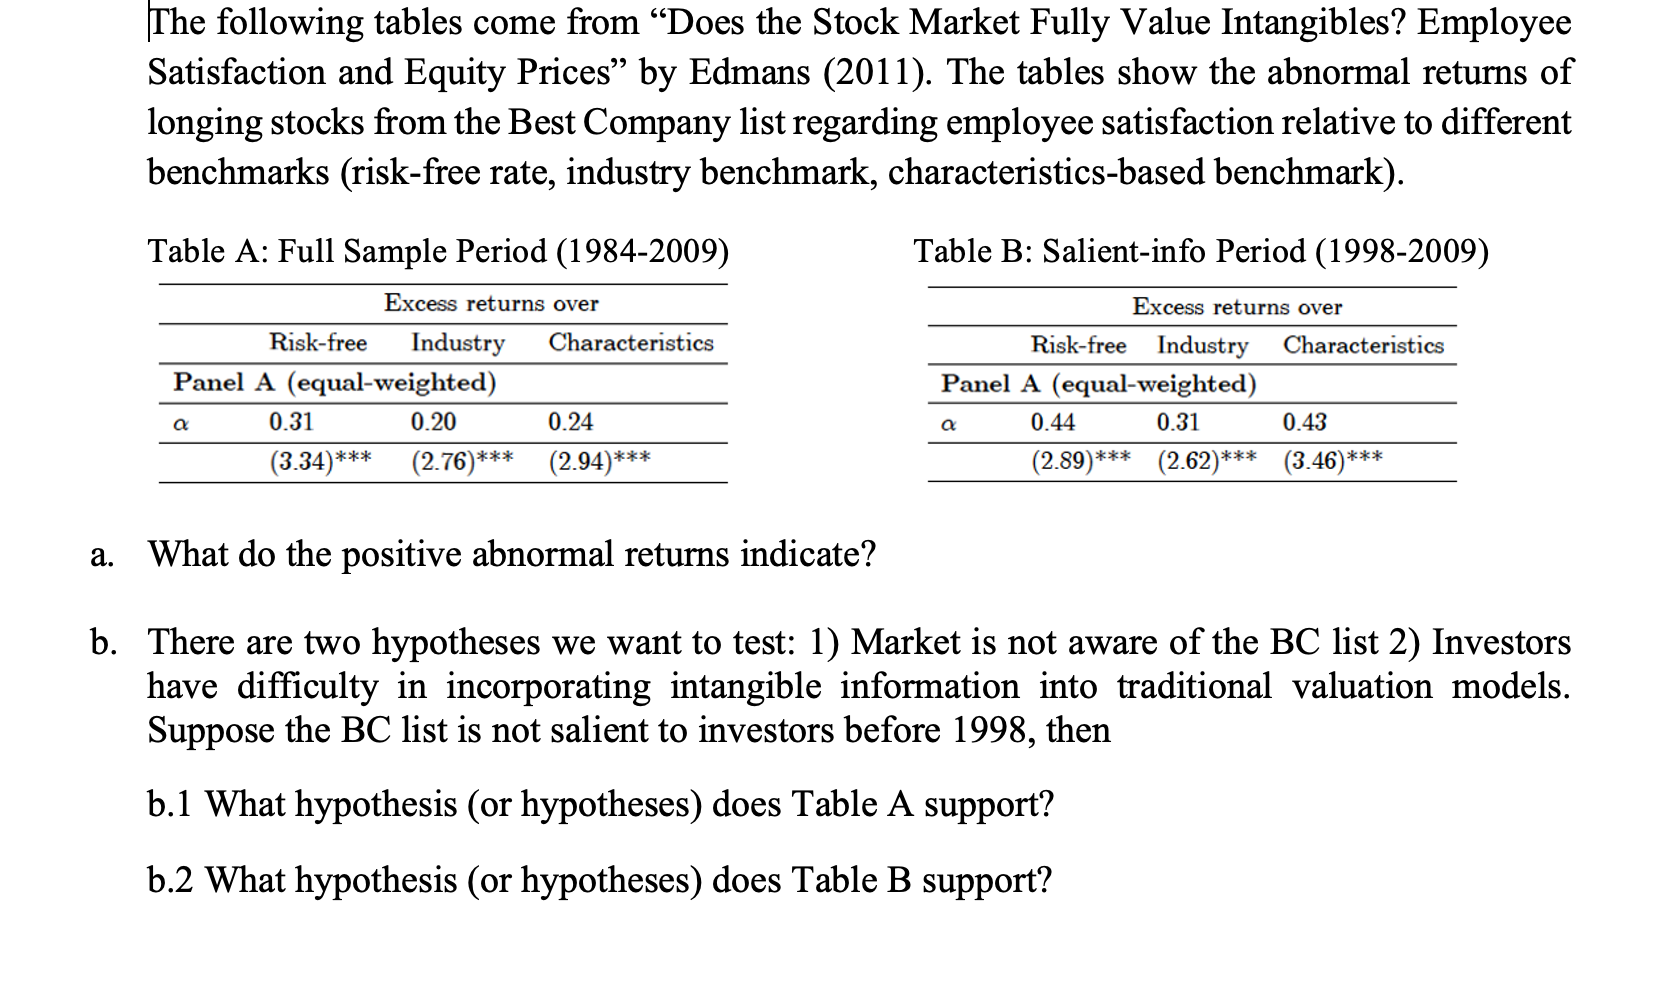
The following tables come from Does the Stock Market Fully Value Intangibles? Employee Satisfaction and Equity Prices by Edmans (2011). The tables show the abnormal returns of longing stocks from the Best Company list regarding employee satisfaction relative to different benchmarks (risk-free rate, industry benchmark, characteristics-based benchmark). Table B: Salient-info Period (1998-2009) Table A: Full Sample Period (1984-2009) Excess returns over Risk-free Industry Characteristics Panel A (equal-weighted) a 0.31 0.20 0.24 (2.94)*** Excess returns over Risk-free Industry Characteristics Panel A (equal-weighted) 0.44 0.31 0.43 (2.89)** (2.62) (3.46)*** a ***** (3.34)*** (2.76)*** a. What do the positive abnormal returns indicate? b. There are two hypotheses we want to test: 1) Market is not aware of the BC list 2) Investors have difficulty in incorporating intangible information into traditional valuation models. Suppose the BC list is not salient to investors before 1998, then b.1 What hypothesis (or hypotheses) does Table A support? b.2 What hypothesis (or hypotheses) does Table B support? The following tables come from Does the Stock Market Fully Value Intangibles? Employee Satisfaction and Equity Prices by Edmans (2011). The tables show the abnormal returns of longing stocks from the Best Company list regarding employee satisfaction relative to different benchmarks (risk-free rate, industry benchmark, characteristics-based benchmark). Table B: Salient-info Period (1998-2009) Table A: Full Sample Period (1984-2009) Excess returns over Risk-free Industry Characteristics Panel A (equal-weighted) a 0.31 0.20 0.24 (2.94)*** Excess returns over Risk-free Industry Characteristics Panel A (equal-weighted) 0.44 0.31 0.43 (2.89)** (2.62) (3.46)*** a ***** (3.34)*** (2.76)*** a. What do the positive abnormal returns indicate? b. There are two hypotheses we want to test: 1) Market is not aware of the BC list 2) Investors have difficulty in incorporating intangible information into traditional valuation models. Suppose the BC list is not salient to investors before 1998, then b.1 What hypothesis (or hypotheses) does Table A support? b.2 What hypothesis (or hypotheses) does Table B support


