Answered step by step
Verified Expert Solution
Question
1 Approved Answer
The following tables show the population (in millions) of four regions in various years and give the average birth and death rates for these


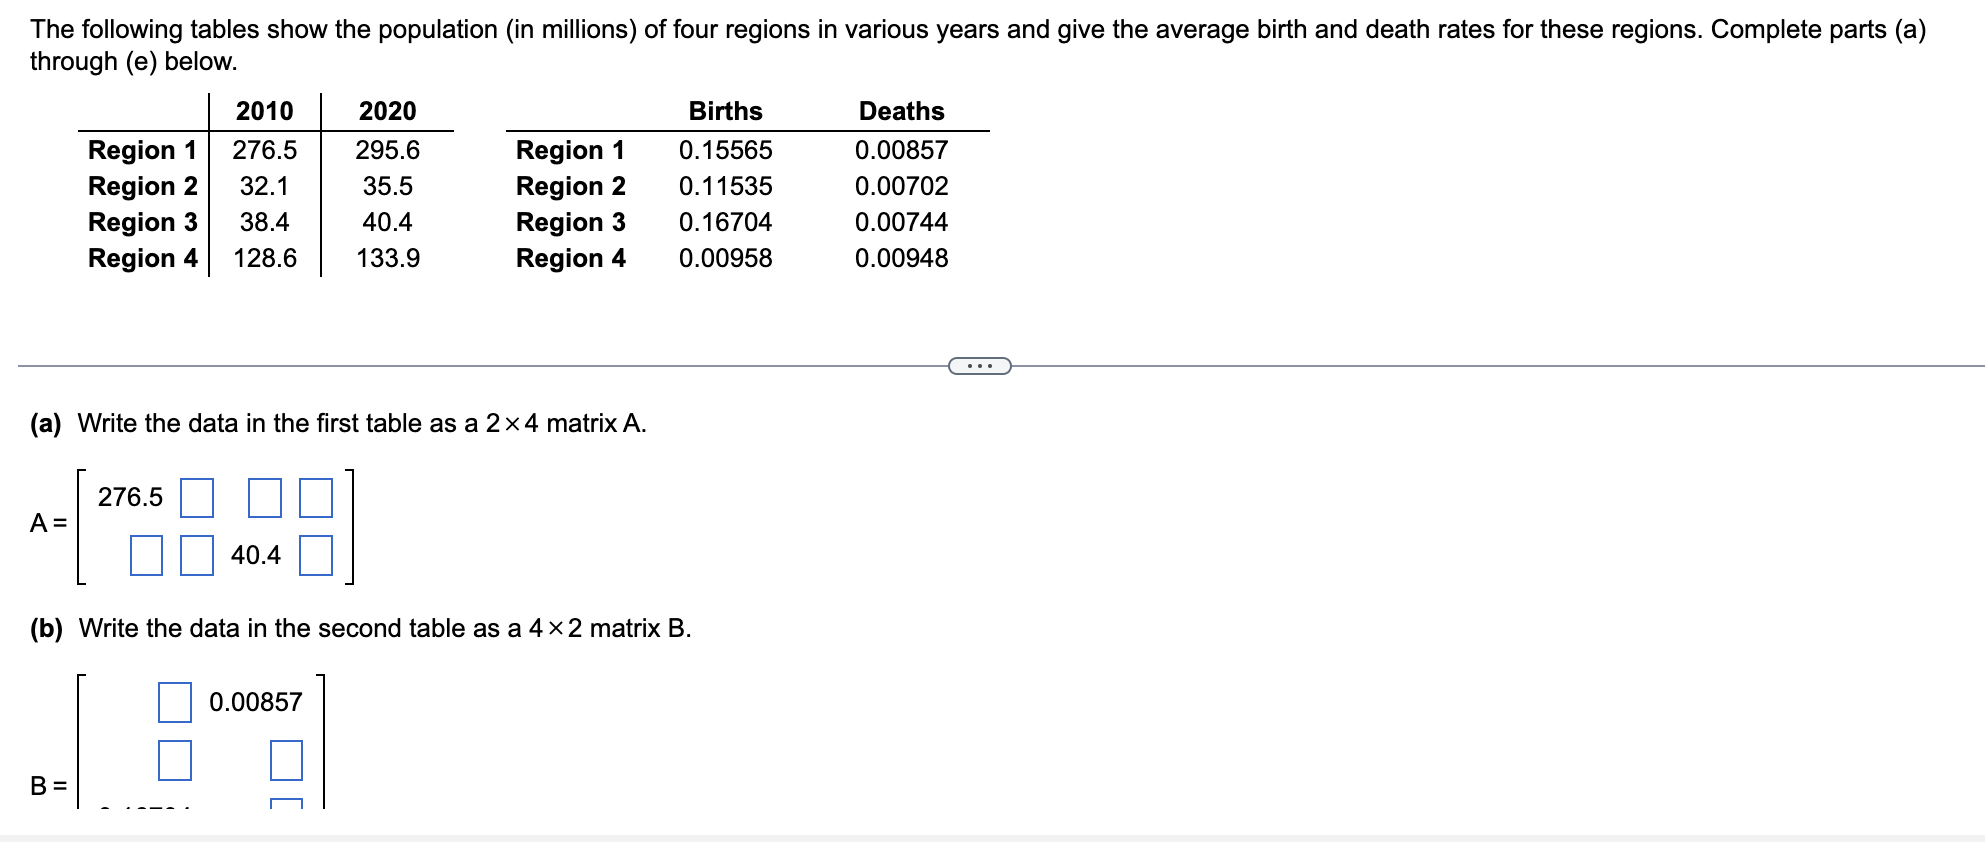
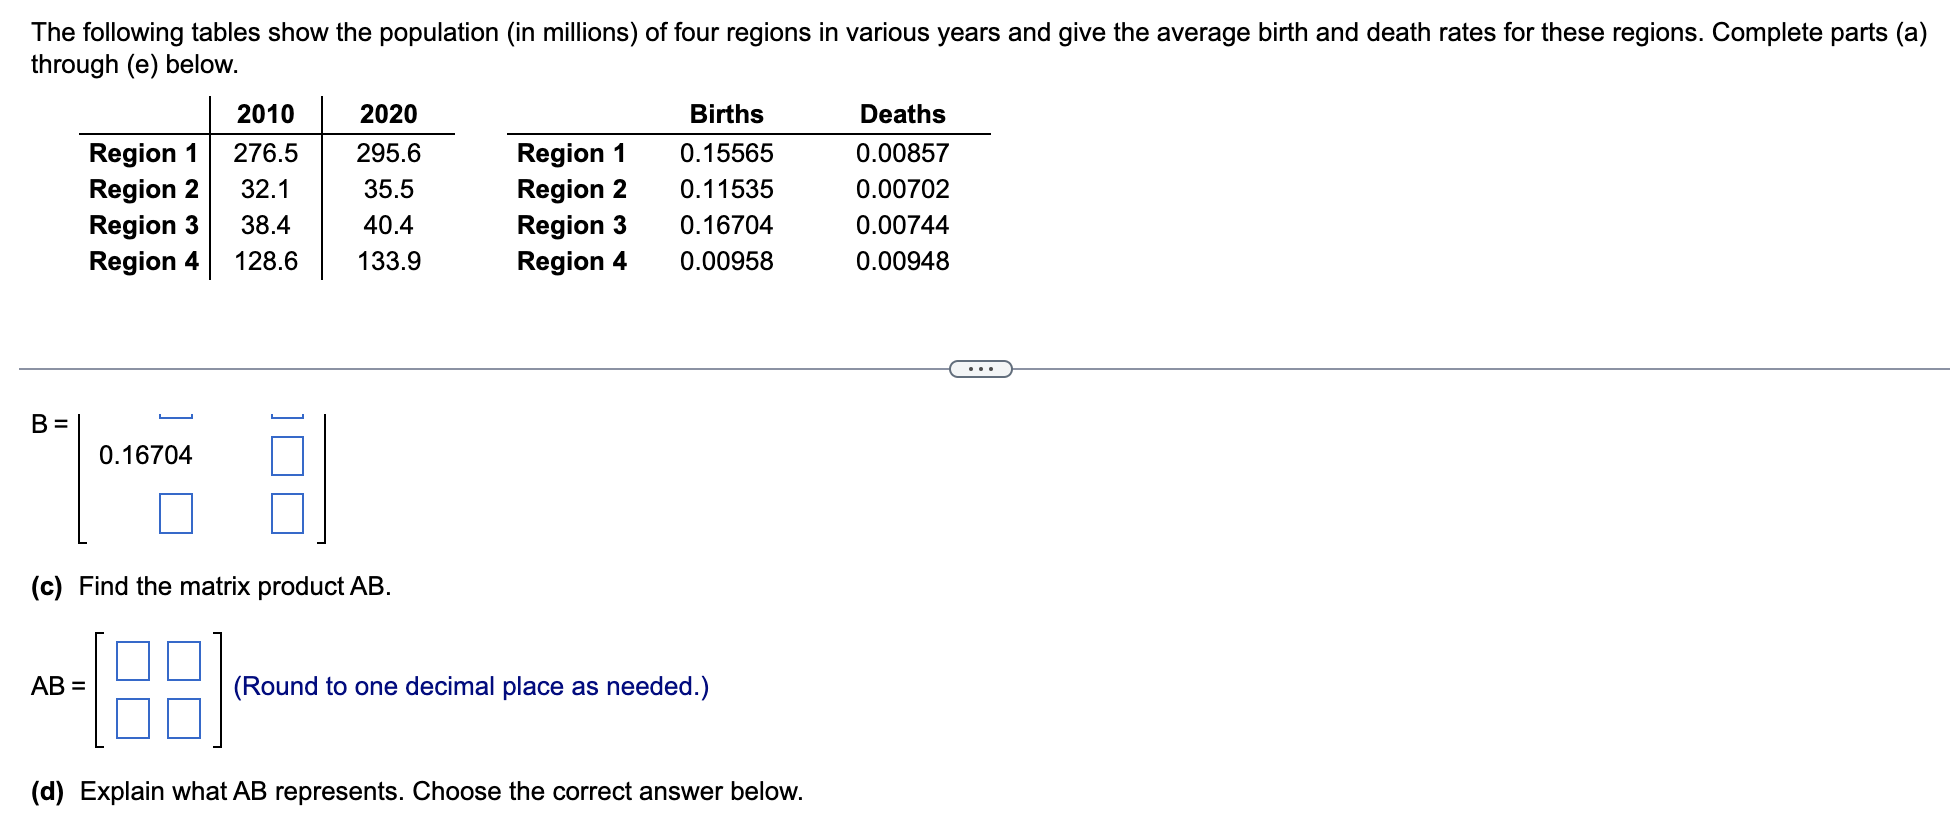
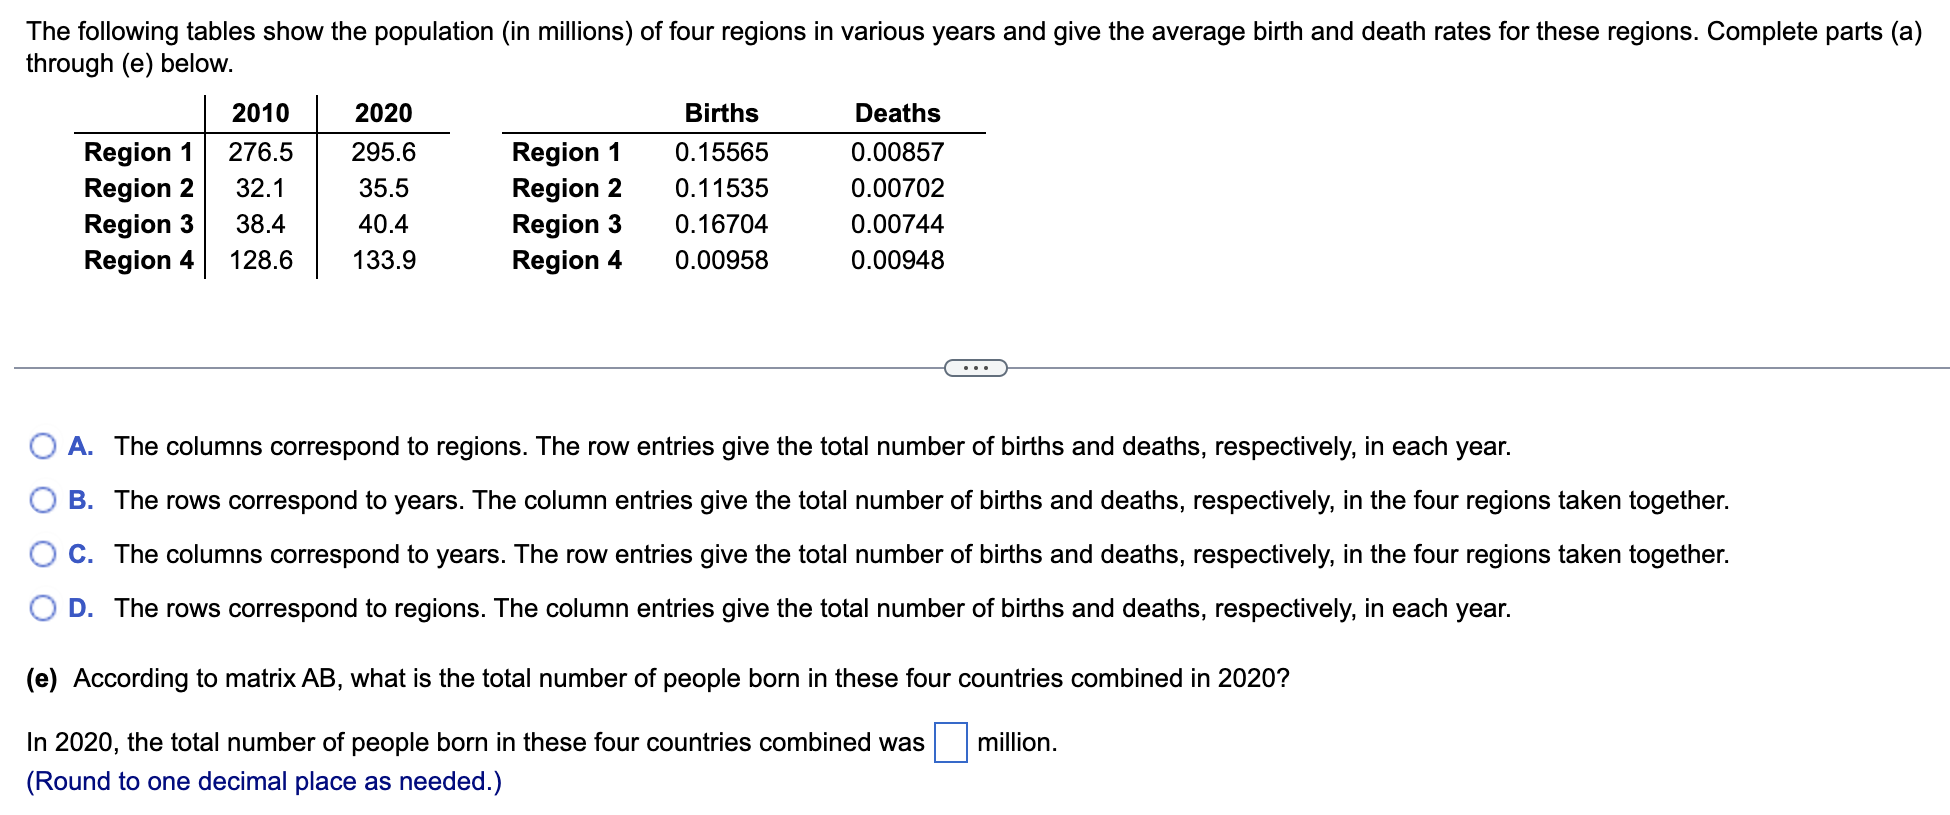
The following tables show the population (in millions) of four regions in various years and give the average birth and death rates for these regions. Complete parts (a) through (e) below. 2010 2020 Births Deaths Region 1 276.5 Region 2 Region 3 Region 4 295.6 Region 1 0.15565 0.00857 32.1 38.4 128.6 35.5 Region 2 0.11535 0.00702 40.4 133.9 Region 3 Region 4 0.16704 0.00744 0.00958 0.00948 (a) Write the data in the first table as a 24 matrix A. 276.5 A = 40.4 (b) Write the data in the second table as a 42 matrix B. B = 0.00857 ... The following tables show the population (in millions) of four regions in various years and give the average birth and death rates for these regions. Complete parts (a) through (e) below. 2010 2020 Births Deaths Region 1 276.5 295.6 Region 1 0.15565 0.00857 Region 2 32.1 35.5 Region 2 0.11535 0.00702 Region 3 38.4 40.4 Region 3 0.16704 0.00744 Region 4 128.6 133.9 Region 4 0.00958 0.00948 B = 0.16704 (c) Find the matrix product AB. AB = (Round to one decimal place as needed.) (d) Explain what AB represents. Choose the correct answer below. The following tables show the population (in millions) of four regions in various years and give the average birth and death rates for these regions. Complete parts (a) through (e) below. 2010 2020 Region 1 276.5 Region 2 32.1 Region 3 38.4 Region 4 128.6 295.6 35.5 Births Region 1 0.15565 Region 2 0.11535 Deaths 0.00857 40.4 Region 3 0.16704 133.9 Region 4 0.00958 0.00702 0.00744 0.00948 A. The columns correspond to regions. The row entries give the total number of births and deaths, respectively, in each year. B. The rows correspond to years. The column entries give the total number of births and deaths, respectively, in the four regions taken together. C. The columns correspond to years. The row entries give the total number of births and deaths, respectively, in the four regions taken together. D. The rows correspond to regions. The column entries give the total number of births and deaths, respectively, in each year. (e) According to matrix AB, what is the total number of people born in these four countries combined in 2020? In 2020, the total number of people born in these four countries combined was (Round to one decimal place as needed.) million.
Step by Step Solution
There are 3 Steps involved in it
Step: 1

Get Instant Access to Expert-Tailored Solutions
See step-by-step solutions with expert insights and AI powered tools for academic success
Step: 2

Step: 3

Ace Your Homework with AI
Get the answers you need in no time with our AI-driven, step-by-step assistance
Get Started


